Why Bitcoin Bulls Are Poised to Break $20,000 in the Month
Set just below the 2017 all-time high, Bitcoin has been moving sideways with low volatility in recent days. The crypto market is preparing to close another monthly candle in the coming days. This event is set to move BTC and other cryptocurrencies, but in which direction?
At the time of writing, Bitcoin (BTC) is trading at $19,000 with a 0.4% gain and 2% loss in the last 24 hours and 7 days respectively. The benchmark cryptocurrency has been one of the worst performing assets in the top 10 by market capitalization as XRP (+30%) and Solana (+7%) take the lead.

Bitcoin option expiration will bring volatility to the market
The current status quo in the market may come to a decision as this monthly candle will coincide with the expiration of over 100,000 BTC in options contracts. This event often brings volatility to the market as major players push to move the price closer to the strike price.
Data from Coinglass indicates that there is over $5 billion in open interest in Bitcoin options, as major players unwind their positions and shift them, the cryptocurrency is likely to see more action. According to the team behind KingFisher, a platform for viewing crypto derivatives data, the more likely scenario is on the upside.
In the short term, as monthly closes and options expire, the price of Bitcoin could quickly trend towards $20,000. Volatility could be driven by an increase in short positions opened as BTC trended sideways at its current levels.
If bulls can push Bitcoin to the upside by exiting these short positions, the price action could become more violent and lead to a longer relief rally. The team behind King Fisher commented the following:
Probably some water hedging activity related to the end of the month
We could see a jump to 19.8k in a matter of hours
TWAP Long ended, either reducing carry, vol fund, options desk.
Some short liquidations have gone through the engine, we could expect more very soon pic.twitter.com/MQ9xEdSRks
— TheKingfisher (@kingfisher_btc) 26 September 2022
What a Green Monthly Close Could Mean for Bitcoin
Additional data from the team behind Material Indicators claims that Bitcoin has two critical resistance levels if bulls score a green close above $20,000. These levels are around $20,100 and $39,000.
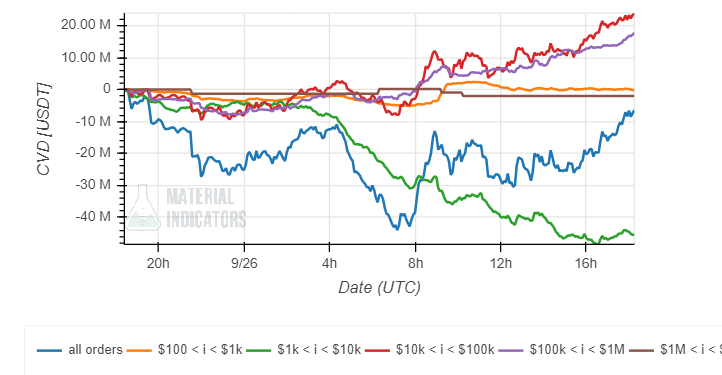
Although Bitcoin is unlikely to reach the recent levels, due to the current macroeconomic conditions, the cryptocurrency may reclaim the high of $20,000. In support of this thesis, Material Indicators noted an increase in the activity of investors with bid orders of $100,000 and investors with bid orders of $10,000.
The activity from these investors was able to “offset the week’s selling pressure with $117 million in market buying”. If this buying pressure persists, the crypto market could see some green after two weeks of trending in the red.

However, the midway point still points to more pain, according to Material Indicators:
There are short-term signs of a potential pump, but the crossing of key moving averages suggests that the broader trend will continue down. Resist the urge to overtrade or FOMO in.


