Weekly Waves: EURUSD, Bitcoin and Gold
-
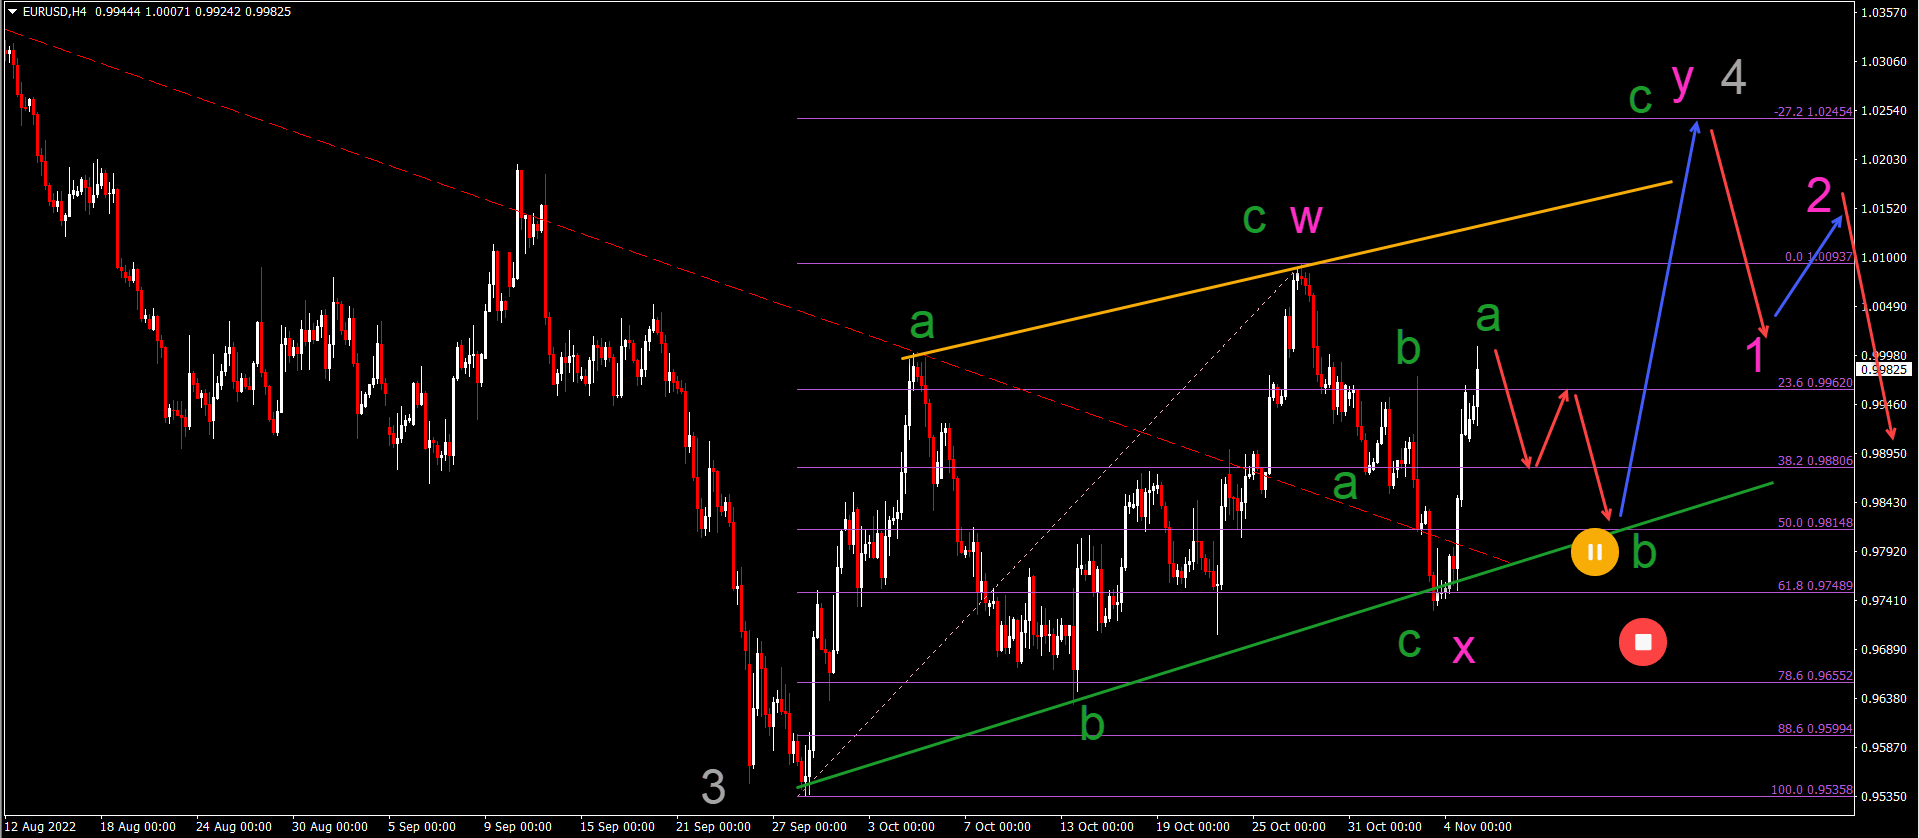
EURUSD made a strong bullish bounce at the 61.8% Fibonacci retracement level, which could take the price up to the -27.2% target near 1.025.
-
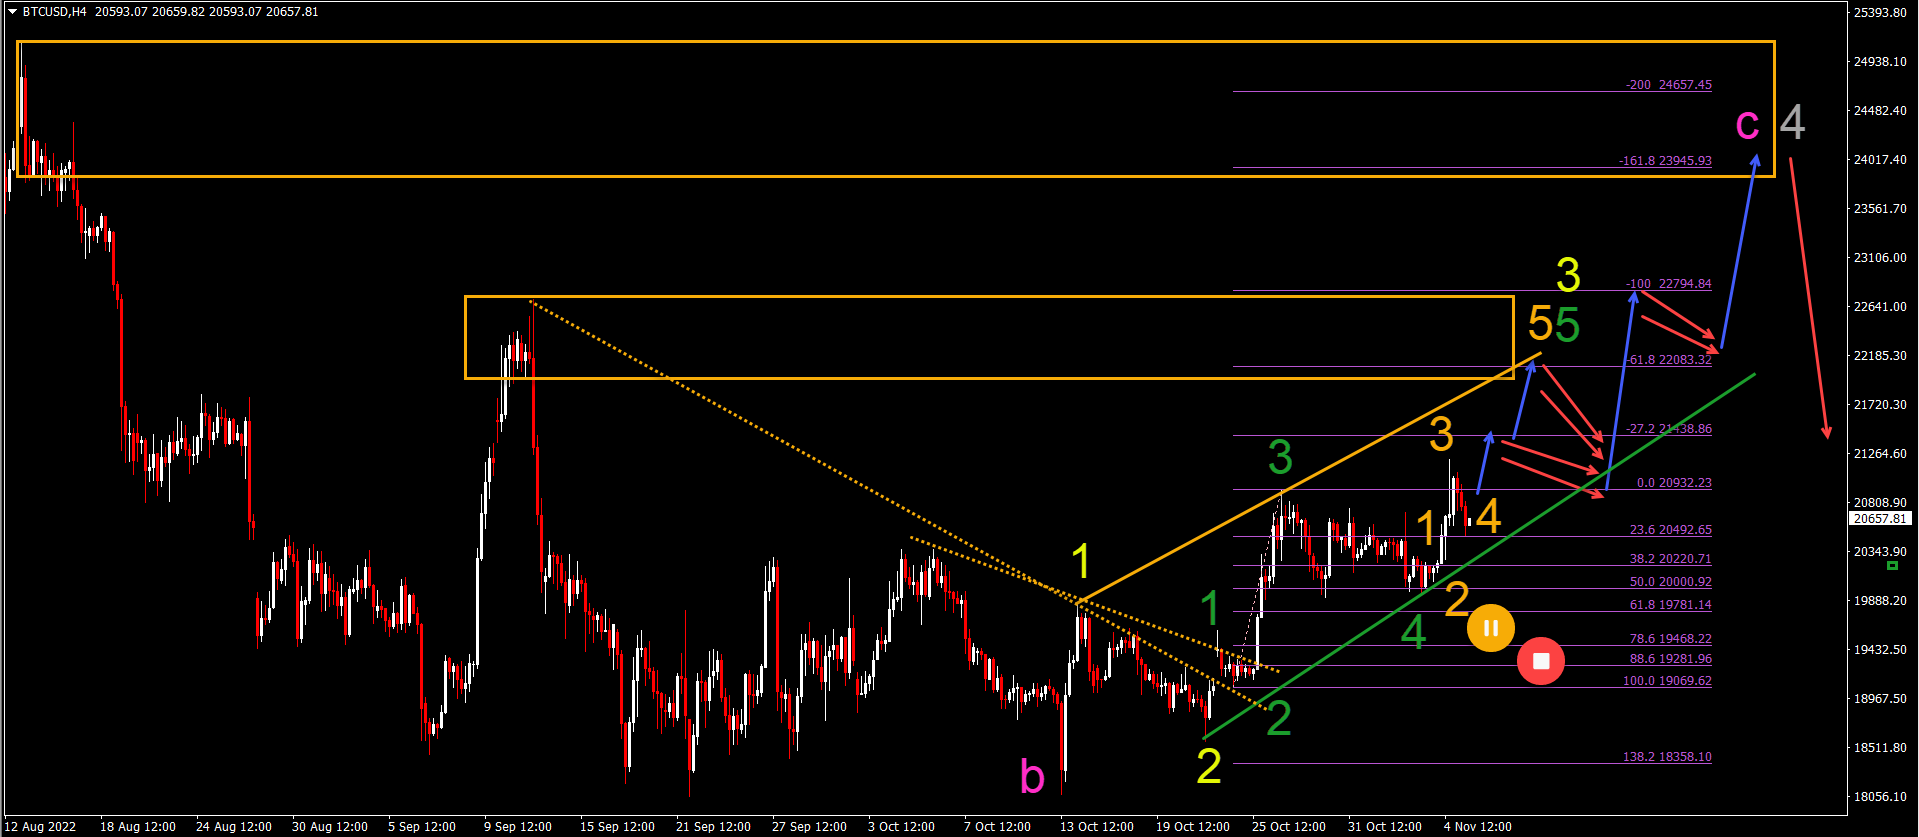
Bitcoin (BTCUSD) is in a short-term bullish uptrend after breaking above the resistance trend lines (dotted orange)
-
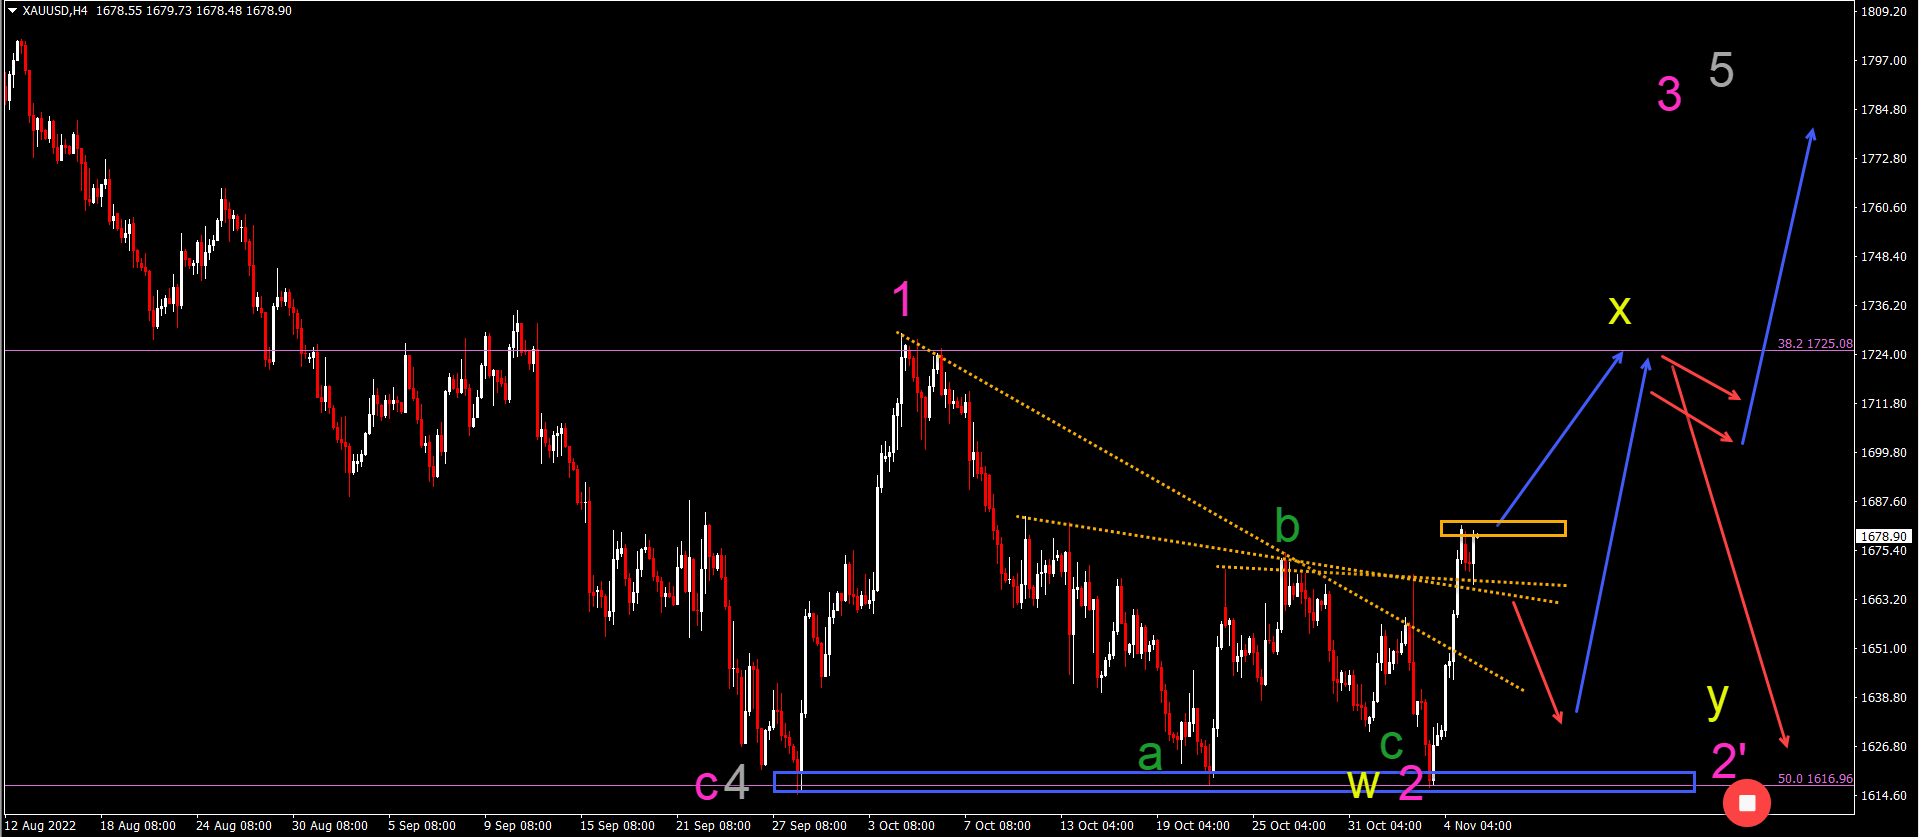
The bullish reversal indicates a double bottom reversal chart pattern. It did not break below the previous low, which means the wave 1-2 pattern is not invalid.
EURUSD bullish bounce of 61.8% Fibonacci
EUR/USD made a strong bullish pullback at the 61.8% Fibonacci retracement level:
-
EUR/USD bullish pullback at the golden mean (61.8% Fib) increases the odds of a bigger bullish retracement.
-
The bullish correction can take place via a WXY (pink) correction.
-
There was an ABC zigzag (green) within the W and X (pink) waves.
-
There may be another ABC (green) within wave Y (pink) of wave 4 (grey).
-
After wave A (green) finishes, we expect a bearish ABC (red arrows) back to the support trend line (green) within wave B (green).
-
A bullish bounce (blue arrow) could take the price up to the -27.2% target near 1.025.

Bitcoin uptrend after bullish breakout
Bitcoin (BTCUSD) is in a short-term bullish uptrend after breaking above the resistance trend lines (dotted orange):
-
BTCUSD is in an uptrend channel with higher highs and higher lows.
-
Bitcoin appears to have completed a wave 4 (green) recently.
-
A move up within wave 5 (green) of wave 3 (yellow) is now expected.
-
This remains valid as long as the price action does not break below the support line (green) of the uptrend channel.
-
There appears to be a 5-wave (orange) pattern within wave 3 (yellow) that could take price action up to the -27.2% and -61.8% Fibonacci targets.
-
A retracement is then expected, followed by another push up.
-
Ultimately, price action should complete a wave C (pink) within wave 4 (grey).

Gold creates a double bottom pattern
Gold (XAU/USD) has bounced off the previous low without breaking it:
-
The bullish reversal indicates a double bottom reversal chart pattern.
-
However, the bounce did not break below the previous low, which means that the wave 1-2 (pink) pattern is not invalid.
-
A break below the bottom would void.
-
The breakout above the resistance trend lines (dotted orange) indicates a bullish swing.
-
This bullish swing can either be part of 1) a wave 3 (pink) or 2) a larger WXY (yellow) within an extended wave 2′ (pink).
-
The wave pattern will depend on the price reaction to the previous peak.

The analysis is done with the indicators and template from the SWAT method simple wave analysis and trading. For more daily technical and wave analysis and updates, sign up to our newsletter


