The power struggle between BTC bulls and bears will lead to…
- Bitcoin price is approaching a support confluence at $21,710, a breakdown of which could lead to a 12% crash.
- Ethereum price bounces back after retesting the $1,700 barrier and is likely to continue to do so until BTC establishes a directional bias.
- The Ripple price is hovering above the $0.340 level, a significant barrier that could make or break the altcoin.
Bitcoin price is showing a lack of bullish momentum as it bounces off the previously established range. This development could result in a bearish outlook if the immediate support cluster is broken. In such a case, Ethereum and Ripple price will likely follow suit and fall.
Bitcoin price at last line of defense
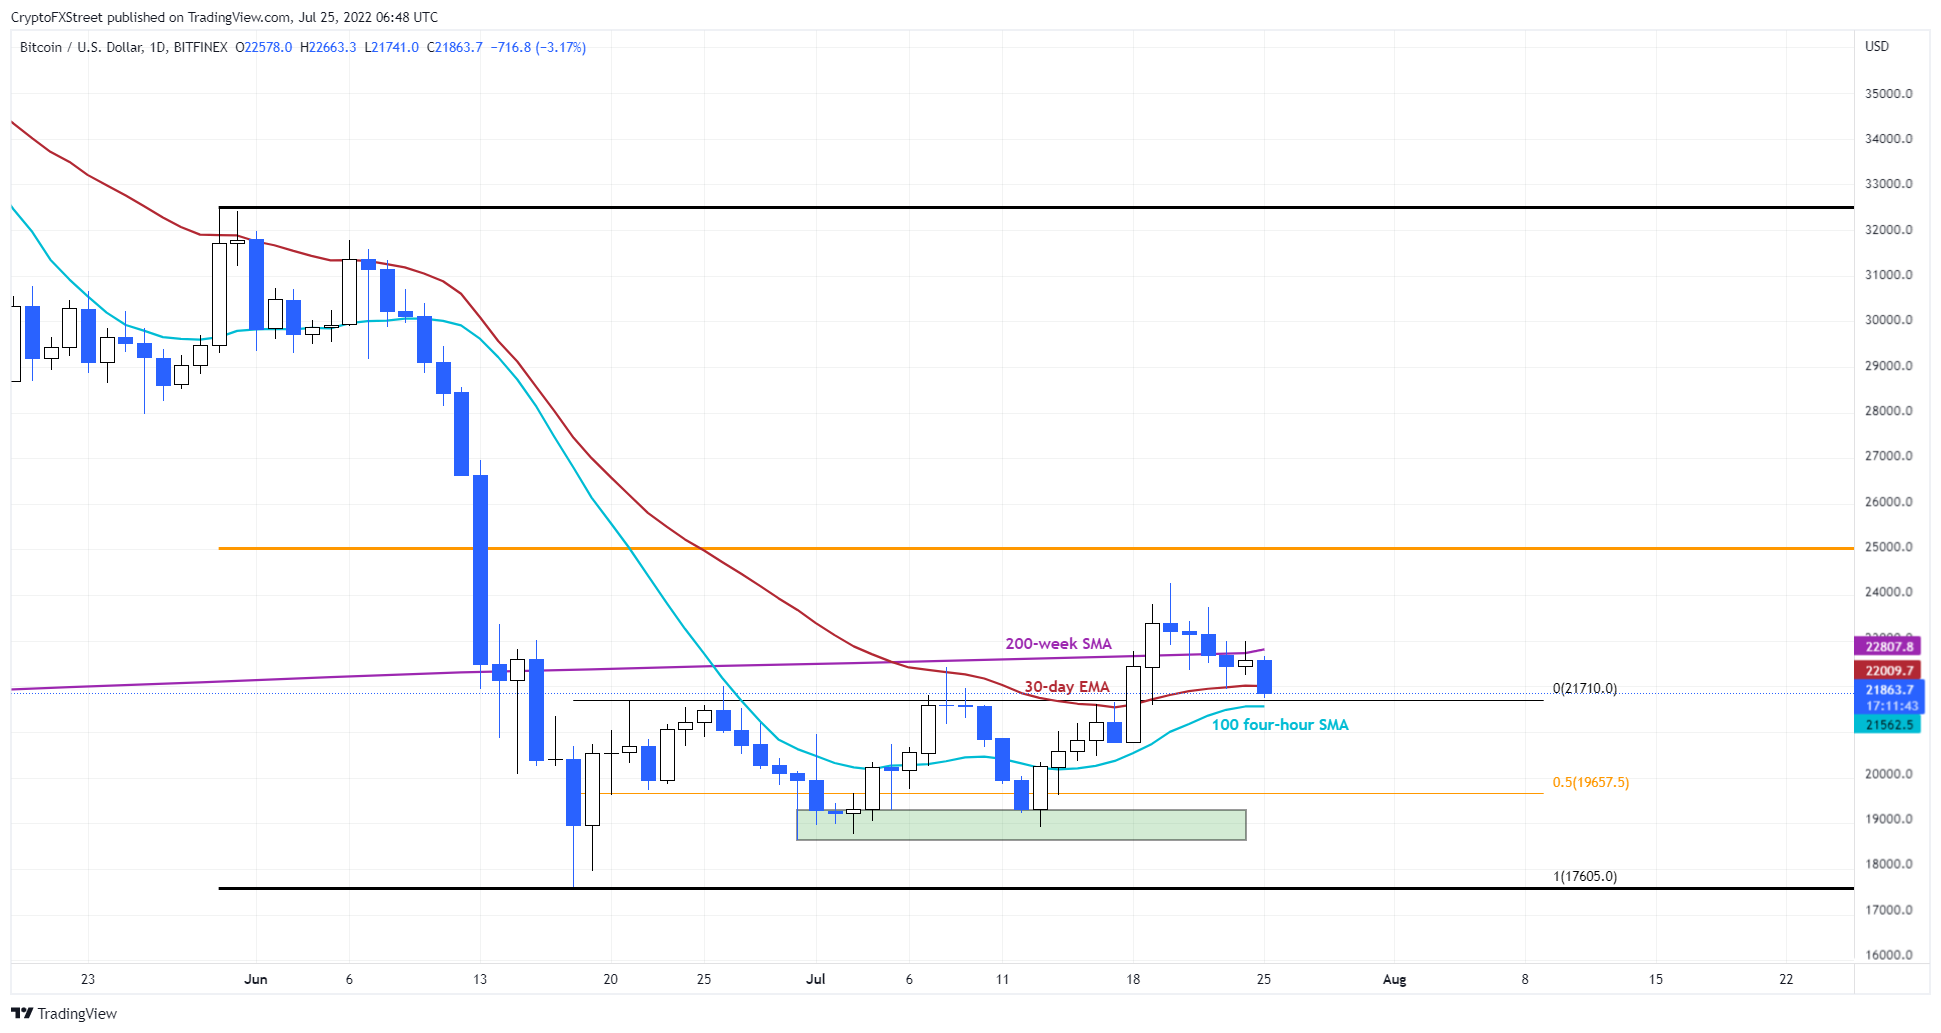
Bitcoin price made a four-hour candlestick close below the 200-week SMA, indicating weakness among buyers. However, bulls have another chance to recover as BTC hovers around the 30-day exponential moving average (EMA) of $22,010 and above the 100 four-hour Simple Moving Average (SMA) of $21,562.
If BTC squanders this opportunity and produces a daily candlestick close below $21,710, it will invalidate any possibility of a bullish outcome. In such a case, market participants can expect the Bitcoin price to drop 10% and retest the midpoint of the range at $19,657.
In some cases, BTC may even dip into the liquidity pool, which ranges from $18,638 to $19,286. Here, buyers can choose to step in and attempt another rally or wait for market makers to push the major crypto to sweep the range to a low of $17,605.

BTC/USD 1-Day Chart
On the other hand, if the Bitcoin price bounces off the support confluence at $21,710, there is a good chance that the June 13 rally will continue. Under these circumstances, BTC could retest the $25,000 psychological level.
Ethereum price poised for more retracement
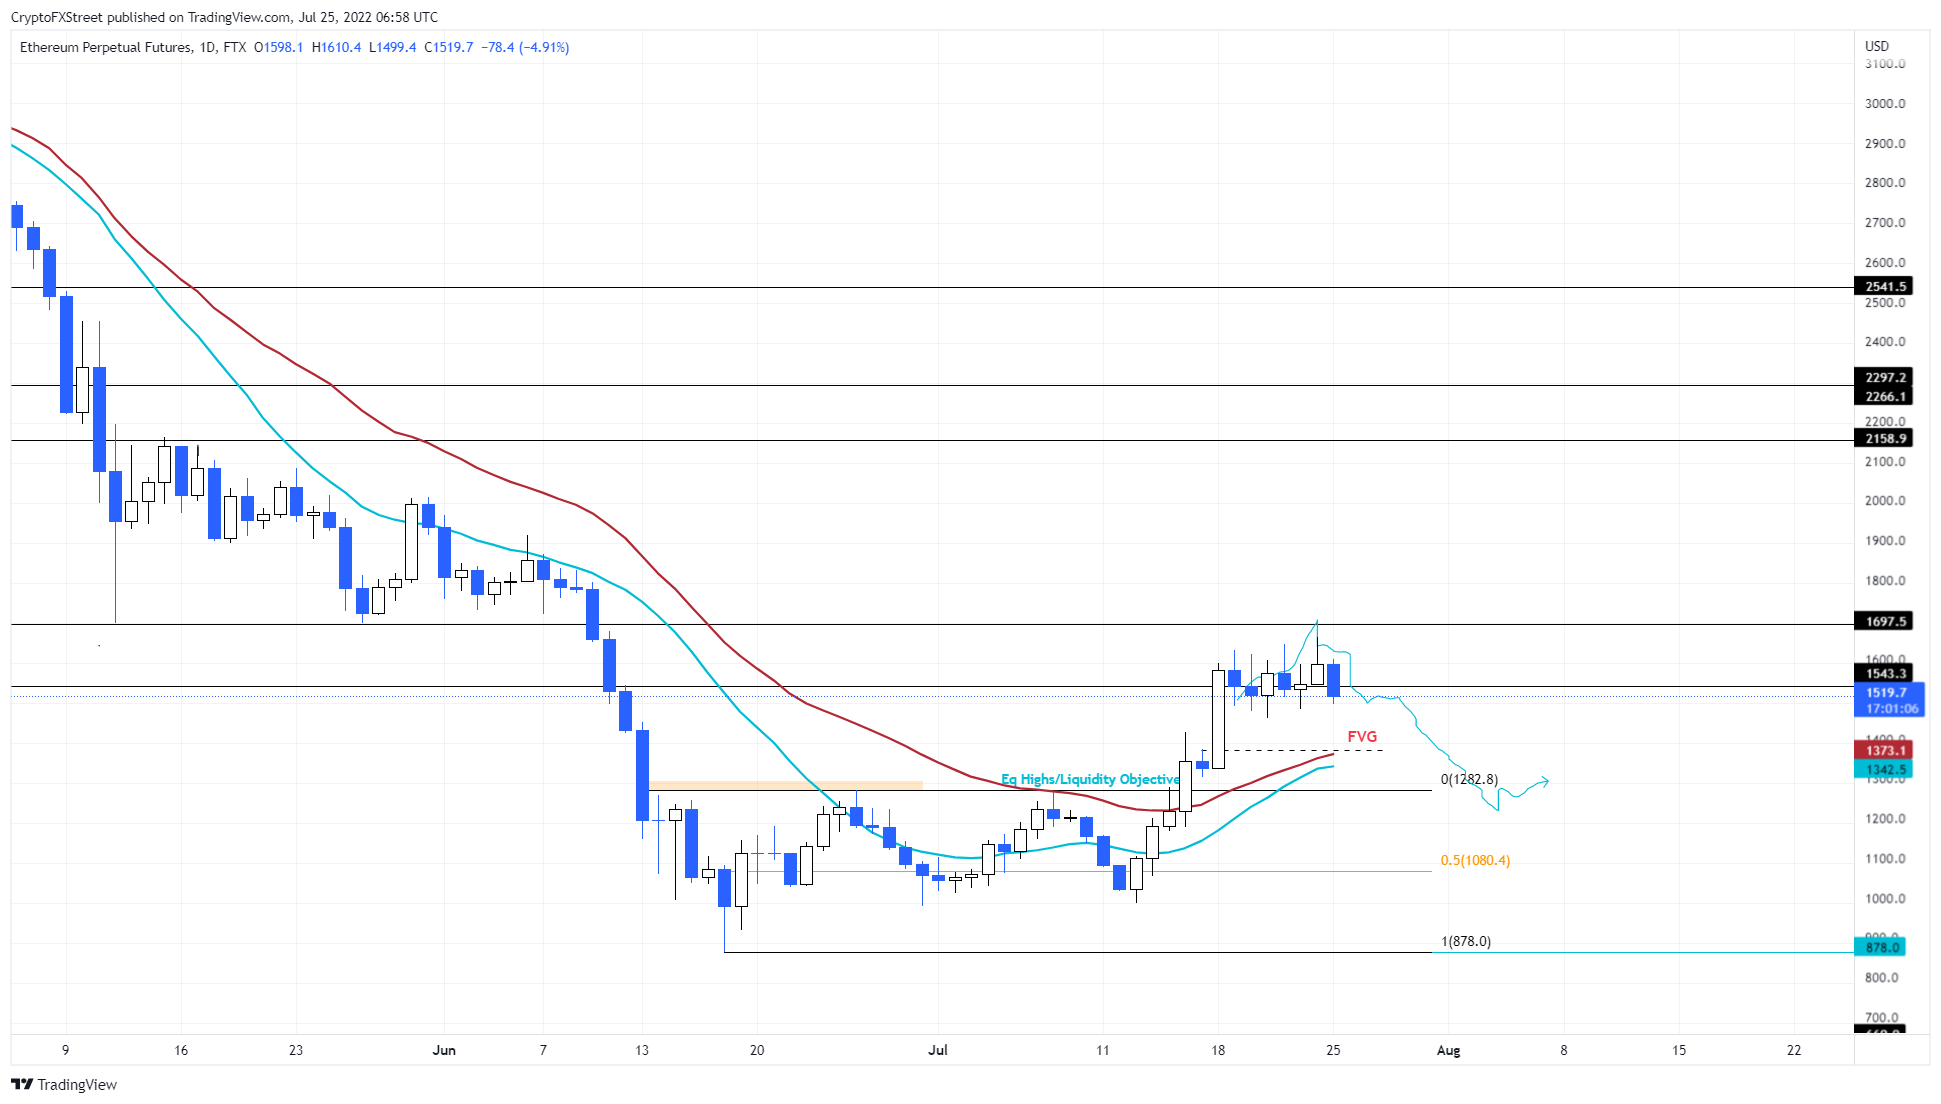
The Ethereum price came close to marking the $1,700 barrier on July 24, but fell short of the momentum. As a result, ETH is currently hanging an edge outside the $1,543 support level. A successful reversal of the said level into a resistance barrier could trigger an 8% drop to reverse the price inefficiency at $1,383.
In some cases, the Ethereum price may retest the range of $1,284. While this decline may appear bearish, it is a bullish retracement and is likely to trigger a bounce from the ETH price.

ETH/USD 1-Day Chart
While things are looking up for the Ethereum price, a daily candlestick below the $1,284 support level will invalidate the bullish outlook. In such a case, ETH may return to the $1,080 support level.
Ripple price at a turning point
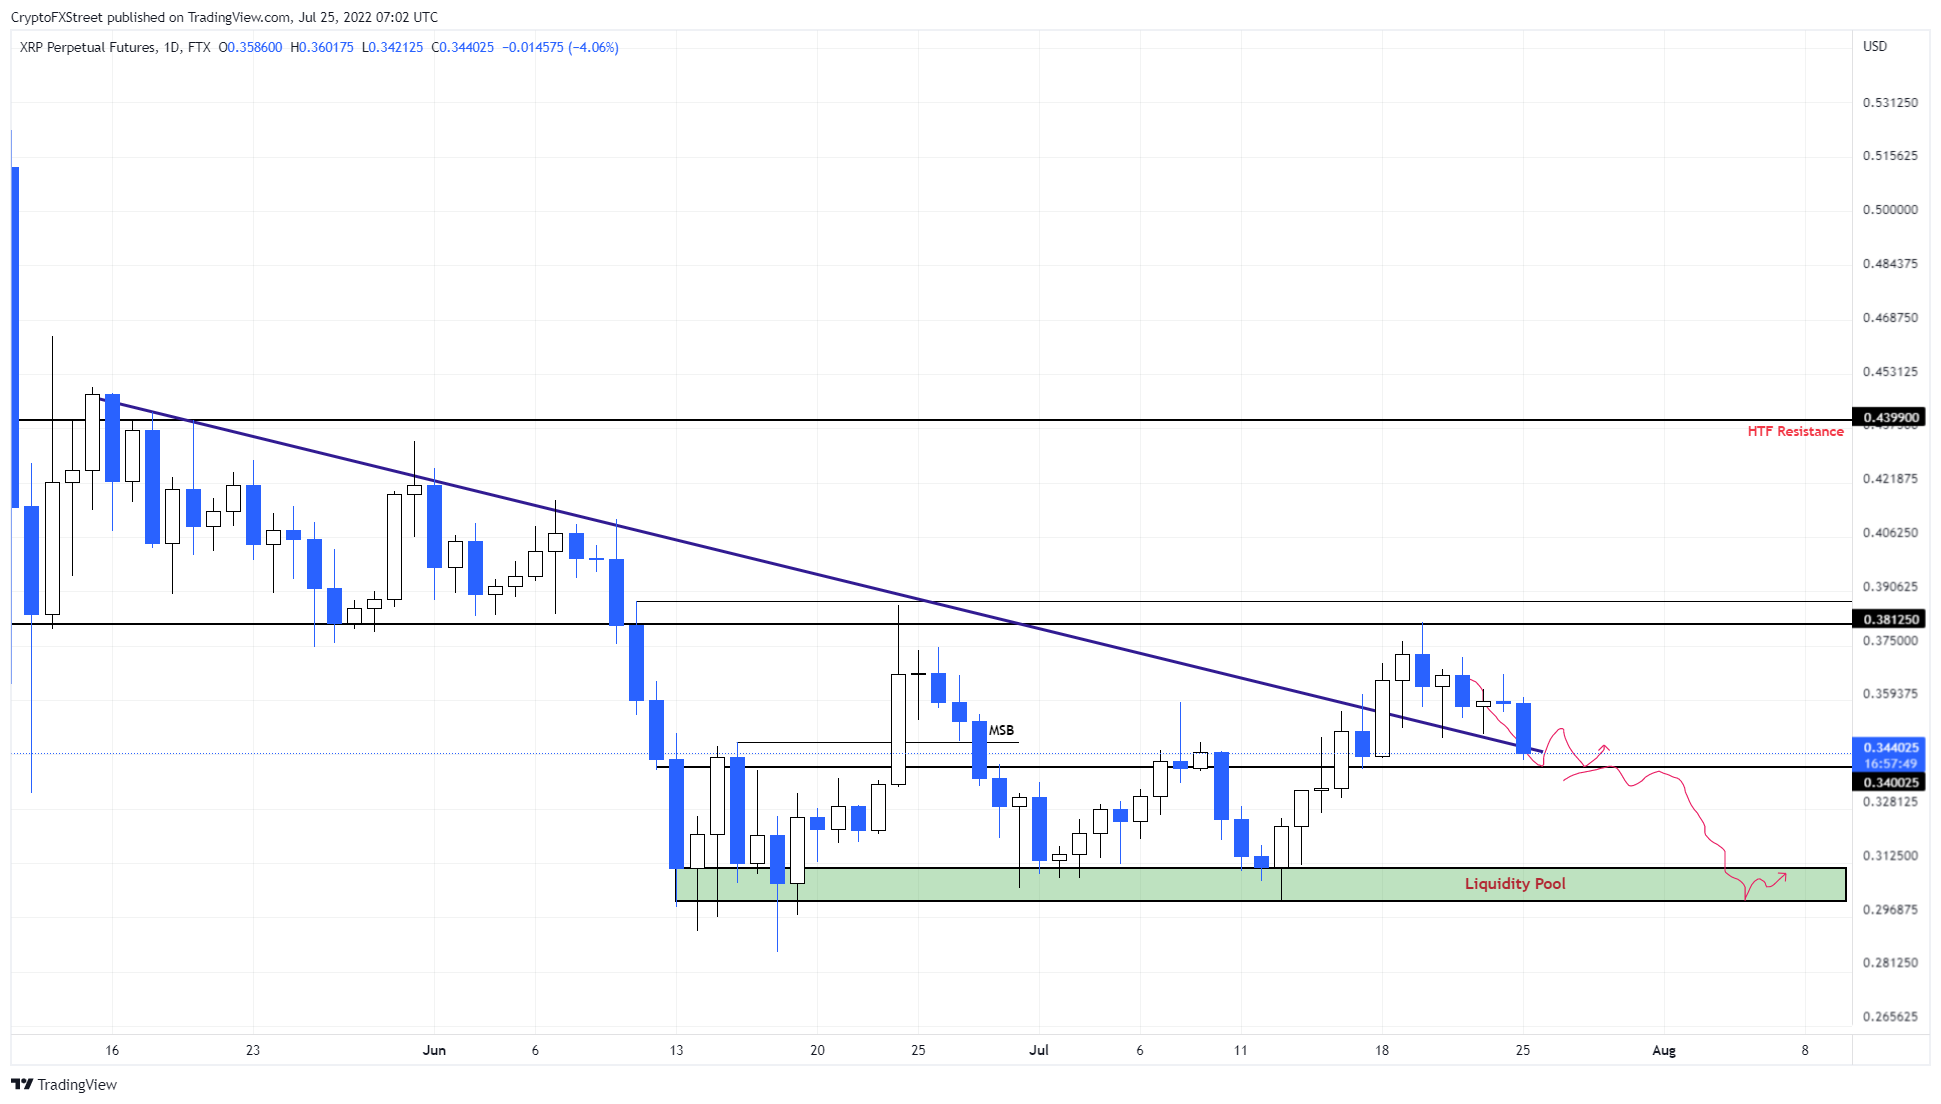
Ripple price has reverted to its moves since June 18, indicating the lack of strength among buyers. This move has not only undone the gains, but is currently threatening to go lower if the $0.340 support confluence is broken.
In the event of a breakdown, the Ripple price may return to the liquidity pool, which ranges from $0.301 to $0.311.

XRP/USD 1-Day Chart
Regardless of the bearish outlook, if the Bitcoin price recovers, the Ripple price will follow suit. In such a case, a bounce from the $0.340 level is likely to bring the XRP price to $0.380. If momentum is high, a sweep of the $0.387 double top seems plausible.


