Is Bitcoin Starting to Trend Higher? (BTC-USD)

The Aeon
Produced by Ryan Wilday with Avi Gilburt and Jason Appel
In a previous article, “Bitcoin: More Rough Waters Ahead,” I focused on the possibility of Bitcoin (BTC-USD) slipping to $13,300, noting that the November 2022 break at $16K opened the door to a longer bear market. I also offered a bullish option. In trading it is always important to know where you are going wrong. I gave the bullish option low probability. But one should not be surprised that markets take a path with low probability. Low does not mean zero, so trading with an alternative point of view in mind helps with risk management.
In this article, I will update my perspective on Bitcoin action, given its recent move higher. I’ll explain why I’m not entirely thrilled with this move. However, I am cautiously watching for more signs that the trend has changed. I want to also update the tactical approach I gave in the article above so you know how I deal with this action with real money.
The forest before the trees
First, I want to zoom out to see the country’s position on the daily chart. Most people know that Bitcoin has been in a strong downtrend since its peak in 2021. But if you were to believe crypto traders on Twitter, or ‘CT’ as they have been called, a new bull market has started. CT is a notoriously emotional audience, flipping back and forth according to the size and color of candles. And January’s one-month candlestick on the Bitcoin chart has a lot in common with monthly bull market candles of 2017, 2019 and 2021.

Tweet expressing bullishness regarding Bitcoin (twitter.com)
But a deep understanding of how market trends are important for successful trading. Trend reversals are notoriously difficult to trade, because many fail. Reversals often excite the crowd, lure them in and spit them out. The faster the move, the more people rush in.
There are many methods of determining a trend, and I have a few that I like to use. But for the sake of this article, I will stick to the Elliott Wave analysis.
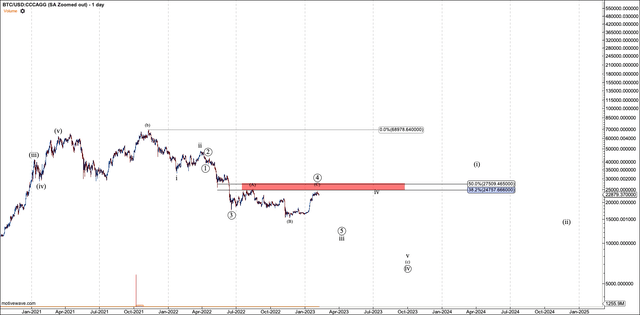
In Elliott Wave analysis, in general, the trend is down if the price is below the 50% retracement of an advancing third wave. It is the level below which a chart can still form a reasonable fourth wave. On my chart, that level is $27,500. The price is still below that level, but it won’t take much to attack it.
Sustaining that level is the key to turning from the bearish trend in 2022 into another bull market. When I use the term “sustain” with respect to resistance levels, I’m generally looking for consolidation above that level and then another break higher. It looks like Bitcoin bulls will soon show what they’re made of as $27,500 approaches.

Daily chart of Bitcoin (Motivewave software)
Evaluation of the reversal
In Elliott Wave we also look at the structure of a reversal, to assess the probability of success. A strong reversal starts with five waves. Furthermore, the strongest confirmation you can get from a market happens after the following steps.
-
The market or asset forms five waves from a low and above resistance, which is usually a 50% retracement on the third wave down. We will call this structure wave 1.
-
The pullback that begins after the five waves should hold the .618 retracement of the five waves, or .764 at worst.
-
At that point, a breakout above the first five waves gives you more confirmation of a market bottom.
With my subscribers, I like to call these three steps “the mantra.” I often repeat some form of this mantra as a reversal in the crypto market patterns. In fact, I repeated it many times in 2022, with each reversal. Because we never saw the completion of all three steps, it should have deterred subscribers from aggressive buying. (Though each makes their own trades.)
Note that confirmation should not be confused with certainty. I don’t work with a crystal ball. I analyze the market probabilistically. As I like to say, “The certainty in the markets is zero at all times.” This means that we must take trades that have low risk and high potential reward, and stop when necessary.
In Bitcoin’s January move, not even #1 above has been completed. So even if Bitcoin is working on a bottom, the risk of a new low is high. That said, this move is still evolving.
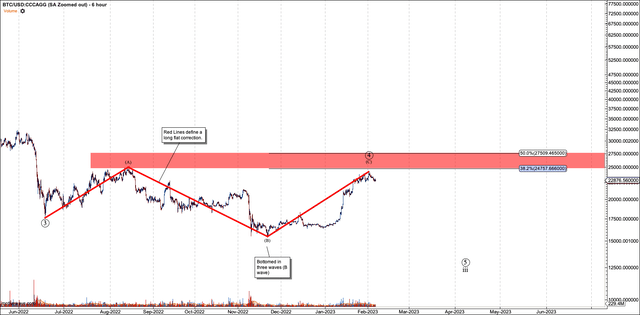
I want to refer you to another artifact on the Bitcoin chart that is important. This is the potential for a broad wave four flat on the chart that started in June 2022. This is almost longer than a similar triangle pattern in Bitcoin in 2018, before it made its final crash at the end of that year. If you know Elliott Wave analysis, you may ask why I call this a wave four flat when Bitcoin made a new low in November. My concern is that the bottom was made in three waves, which suggests that there is a B wave in this flat, not the final wave.

Potential wave four flat in Bitcoin (Motivewave software)
Looking for a solid reversal
With my concerns now out of the way, let’s get to what I’m looking for: for Bitcoin to give us a highly probable indication that it has bottomed. This starts with the three point “mantra” above.
First, we need five waves off the November low. So far Bitcoin has given us three. However, it seems to want to hold as it consolidates in a tight area above the fourth support at $19,900. If that level holds, it should be pushed up towards $26K, and perhaps all the way to the edge of resistance at $27,500.
If the fifth wave above $26K forms, the real test for Bitcoin will be just around the corner. Naturally, it could only go on. But in general, after a five-wave structure as clear as we would see at $27,500, a pullback begins, which I’ll call wave 2. If it comes down correctively and holds support, it can turn around and break higher. That would give us the best confirmation we will ever get that the trend has changed. This support level will be determined after a local top is formed. I estimate it will be in the $18K region.
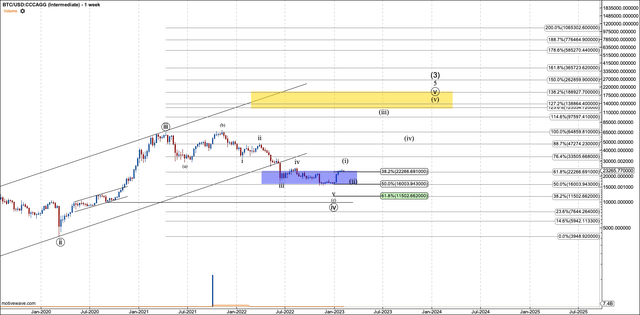
If it pulls back to $18K, holds wave 2 and breaks out, it should work on a major five-wave structure in the mid-$50Ks. Referring to my previous article, not maintaining a break below $16K, my original $125K goal is being met. And the next big market top should appear near $125K.
If this turns out, I will work from my old primary count, which is now an option.

Old primary / current alternative Bitcoin count (Motivewave software)
Tactics
Now let’s talk about tactics. As mentioned in the previous article, I hedged my long-term Bitcoin with a short futures position. Naturally, I quit that trade. But does that mean we should go long? Over the last few weeks I took some long trades, but they were short lived. Now that we are moving into the fourth and fifth waves of this move, the chop will increase. And it seems it already has. Bitcoin has been moving in a tight range for a couple of weeks. In the fourth and fifth quarters, aggressive trading should be avoided, and the size down. That said, scaling down in the interval with quick profit taking works well for experienced trading.
What I’m really waiting for is that retracement of wave 2. If it’s clearly corrective, I’ll look for an aggressive long position. Where I was saving money to make longer-term purchases near $13K, a corrective pullback to the $18-20K region will see me increase my range for those purchases. And if we see a clear reversal, I would consider a futures trade. But it is important to pay close attention to the inability to hold the wave 2 support level when this level is clearly determined. Failure should send Bitcoin down to an expected $13K, albeit with a very long detour.
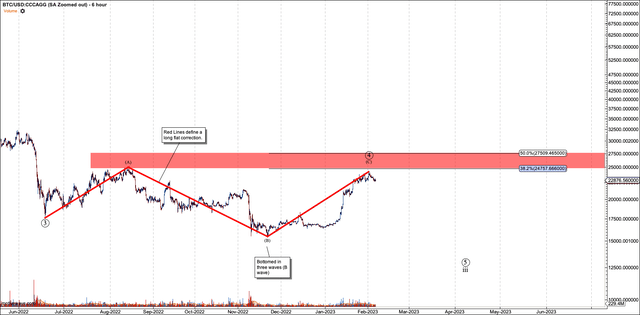
My bullish path is shown in the chart below, rendered in red.

Potential bullish micro in Bitcoin (Motivewave software)
Conclusion
In conclusion, Bitcoin did not take my preferred path as described in my previous article, pushing higher than expected. That move challenged the need to hedge with a short position. But Bitcoin bulls have more work to do to confirm that the bearish trend that started at the top in 2021 has ended. Over the next month or two, I expect Bitcoin to test this recent lift higher, with a move into the $18-20K region. What Bitcoin does with that region will indicate whether or not this move higher will last.


