Donchian Channel on Bitcoin – The Cryptonomist
This article will evaluate the use of one of the most used indicators in the Bitcoin trading landscape: the Donchian Channel, also called the Price Channel.
The Donchian Channel Trading Strategy
Known to traders worldwide since as early as the 1950s, it is nothing more than the set of two lines, which never cross each other, and which respectively represent the maximum-maximum of the last X bars and the minimum-minimum of the same period. It identifies a channel, with two distinct levels, an upper and a lower. This channel always contains prices within it, and when the market makes a move of a certain size to the upper or lower side of the channel, the strategy enters a position right next to the channel levels.
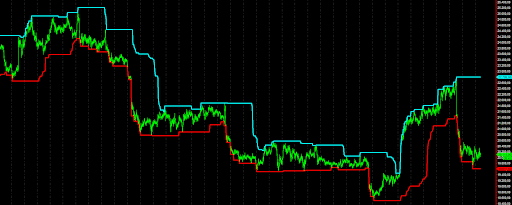
More specifically, it is well known how cryptocurrencies, and Bitcoin in particular, tend to stay in trend for a while, instead of reversing and moving back towards an average value. From this statement comes the idea of using Donchian’s channel for the purpose of capturing the most interesting trends in the market.
To carry out the tests, the Bitcoin spot market will therefore be used. The spot market is the only one that can be used for Italian clients at the time of writing, and since short selling on the spot market requires high margins and quite complex operations, the strategy, at least in the initial phase, will only be allowed to make long trades.
But according to what the major cryptocurrency exchanges, including Binance, which recently received approval to operate in Italy, say, within a short time it will again be possible to return to trading in cryptocurrency futures, which allows greater flexibility in terms of operation and fees.

Testing the Donchian Channel Strategy on Bitcoin
The strategy will be tested on hourly timeframes and the entry level will be dictated by Donchian Channel which will be constructed after an optimization that will lead to a decision on how many bars the instrument should be calculated on. Figure 2 shows the results of this first optimization, which will indicate to the strategy the starting level for placing long orders. These will always be placed at the top level of the channel, based on the idea that after a show of strength the market will continue in the direction taken.
This first analysis was performedt between 10 and 100 periods in increments of 5, identifying the range between 65 and 90 periods as the most stable. This means that it can be worthwhile to buy when the highest high of the last 65-90 hours has been exceeded.
All the cases give gains, albeit slightly different, and consequently one can choose 75 periods, which is an intermediate value, as well as the best for profit in the analyzed cases.
The trades will then be closed on the lower side of the channel, if prices start to fall after an entry, trades will be stopped when the prices of the lower channel are reached.
The historical arc over which the tests are performed includes the last 5 years of the Bitcoin spot market and lasts until September of the current year. This historical arc is not huge, but nevertheless represents a sufficient basis for continuing the study. Then again, Bitcoin itself is a market that is still young all things considered.
The monetary value used for each transaction is $10,000. As you know, Bitcoin is very scalable, therefore you are not obliged to trade a whole Bitcoin, but you can scale the position down a lot. Therefore, the position for each trade will be fixed, and results with reinvestment of profits will not be considered in sequence to get a clearer reading of performance trends over time.
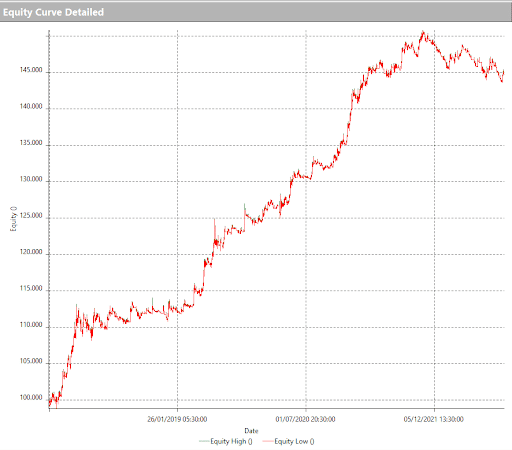
In Figure 3, we can see how the performance curve is satisfactory, and how the strategy wins over almost the entire historical span. Unfortunately, the beginning of 2022 coincided with an abrupt decline on the part of this strategy, which saw the trend change from strongly bullish to bearish.
Comparison with Buy&Hold
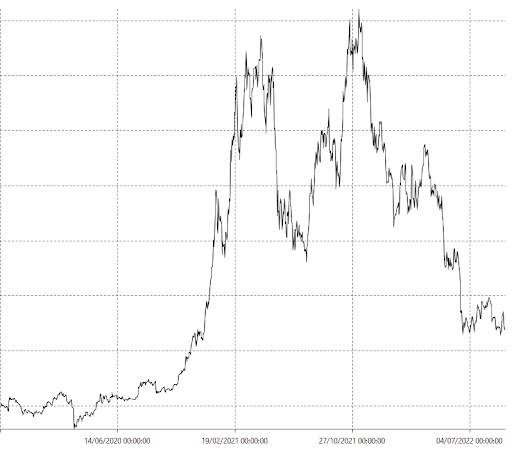
However, this must be contextualized in a particularly difficult period for Bitcoin. The year 2022 has been a strong bearish year, at least for now, and the strategy has suffered quite a bit, understandably right around this time. In fact, comparing the strategy with Buy&Hold, which is the simulation of holding an amount of Bitcoin ($10,000 counter value) from the beginning to the end of the backtest, we see that compared to the Donchian Channel strategy, just holding Bitcoin would have led to far greater risk (Figure 4).
The implementation of the trading strategy
As written earlier, currently the chances of exiting a losing trade occur on the lower Donchian channel and this configures a limitation for the system, which remains limited to only one type of exit to close the position. One will therefore enter one prevent losseswhich represents a losing exit from a trade, and a profit from itwhich is the level that, when touched, will cause positions to be closed in profit.
The values that seemed most appropriate for this market are $500 for stop-loss and $2000 for take-profit, respectively. 5% and 20% vary from the position’s counter value. These parameters for many markets may seem too broad, but Bitcoin has already shown that volatility can become extreme at certain times. Regardless, volatility is high on average every day of the year. The parameters are therefore reasonable for Bitcoin, while they will be less on stocks and futures.
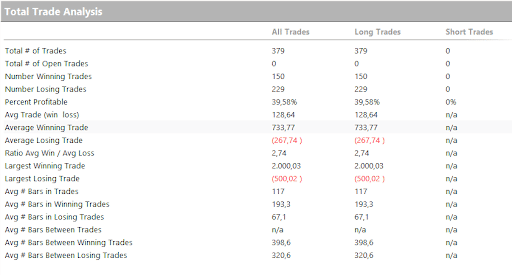
In Figure 5, we see that the system at this point gets a respectable average trade, $128 or so, quantifiable as 1.28% of the position’s counter value. Certainly a comforting figure, able to cover the costs one would face using this strategy in the market.
One can think at this point to include a condition, a filter to the strategy, which will allow it to act only in certain situations. For example, it may be interesting to see how the strategy will behave by only buying when the underlying trend is bullish. This will avoid buying in those situations where the market goes down and is in a so-called bearish trend.
An instruction is then given to the machine that it will only trade on a certain price pattern, that is, when the high of yesterday’s day is higher than the high of 5 days ago. This condition avoids buying in bearish trend situations and this greatly affects the strategy’s drawdown, which used to be around $5000 while now it has dropped to around $3000.
Results and conclusions
In the following figures, you can see all the results that the strategy gets after the filter on the trend has been inserted. The total profit decreases slightly, however the average trade is distributed, rising to $173.
The stock line is also more comfortable, especially the last phase, the one covering the first 9 months of 2022. It takes on a smoother shape than the previous curve.
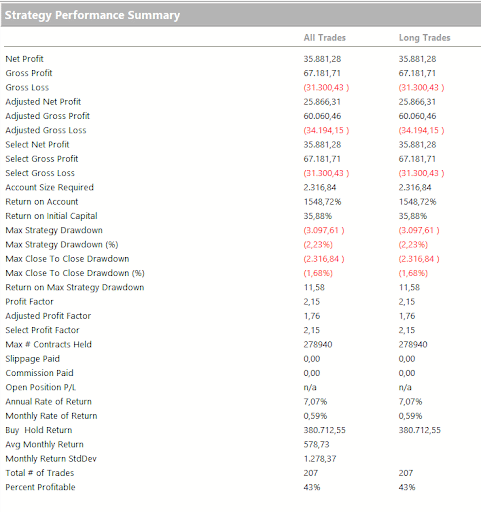
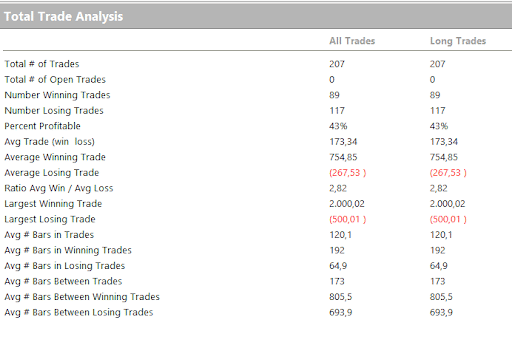
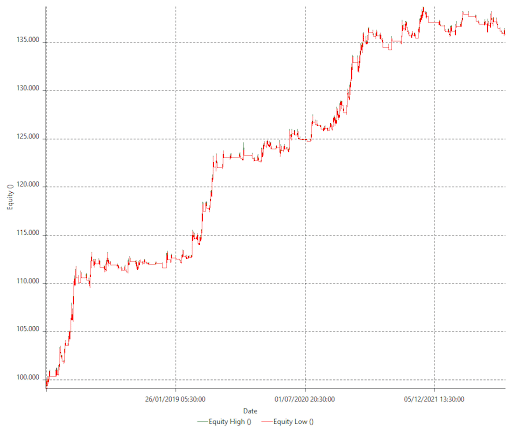
The latest results are absolutely acceptable, potentially usable live, provided the period after the program is benign and in line with the studies done. Something that is of course impossible to determine as of today.
However, Bitcoin is proving to be an extremely profitable market if approached with trend-following logic, and the Donchian Channel was able to confirm this notion. The future is still uncertain, and the last phase of decline does not make one sleep well. The geopolitical situation, regulation, mass adoption and even the age of Bitcoin are all factors that contribute to leveling and changing this market, which nevertheless remains very interesting and may lend itself to other logics in the future.
Until next time!


