Cathie Wood Says $1M Bitcoin (Again); Why she might be right

Marco Bello
Summary of the assignment
Recently, Cathie Wood reiterated her belief that Bitcoin (BTC-USD) could reach $1 million by 2030. She made these remarks in a Bloomberg interview, but this thesis is actually based on a report by ARK Invest from a a few months back.
ARK looks at Bitcoin’s potential market value in 2030 based on various use cases. I analyzed these numbers in a previous article and concluded that from a fundamental perspective it seemed like an ambitious goal.
However, in this article I will present an alternative methodology based on the stock-to-flow model and technical analysis, which actually supports the claims that Bitcoin can reach $1 million by 2030
The numbers don’t add up
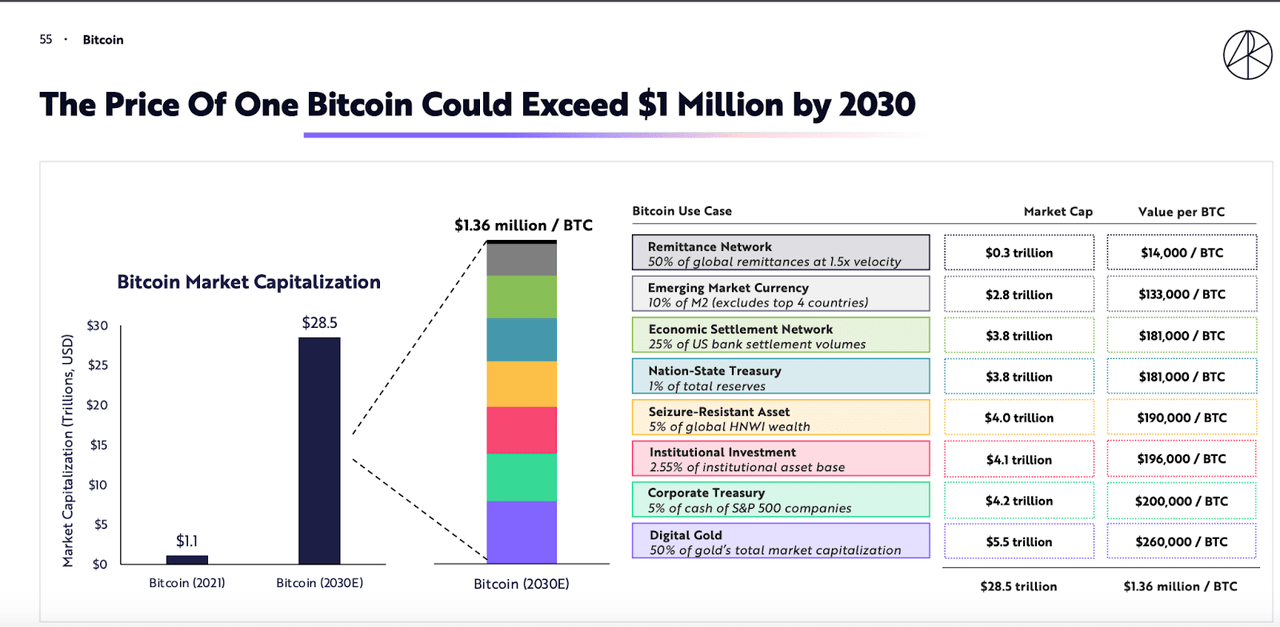
The image below shows how ARK Invest believes Bitcoin can reach a value of over $1 million.

ARK Invest Report (ARK Invest)
The ARK report estimates a market value of the Bitcoin market at $21.5 trillion, and assumes, among other things, that Bitcoin will take market share from gold, become a common ownership interest for companies, and projects that 25% of US banking transactions will be settled in Bitcoin .
In a previous article, I delved into each of these segments, did my own calculations, and arrived at a slightly less bullish projection. I predicted a potential market cap of $12.85 trillion, which would mean a Bitcoin price of $613,000.
However, a price target of $1 million is supported by the stock-2-flow model, and we can also reach this target using Elliott Waves.
The S2F model
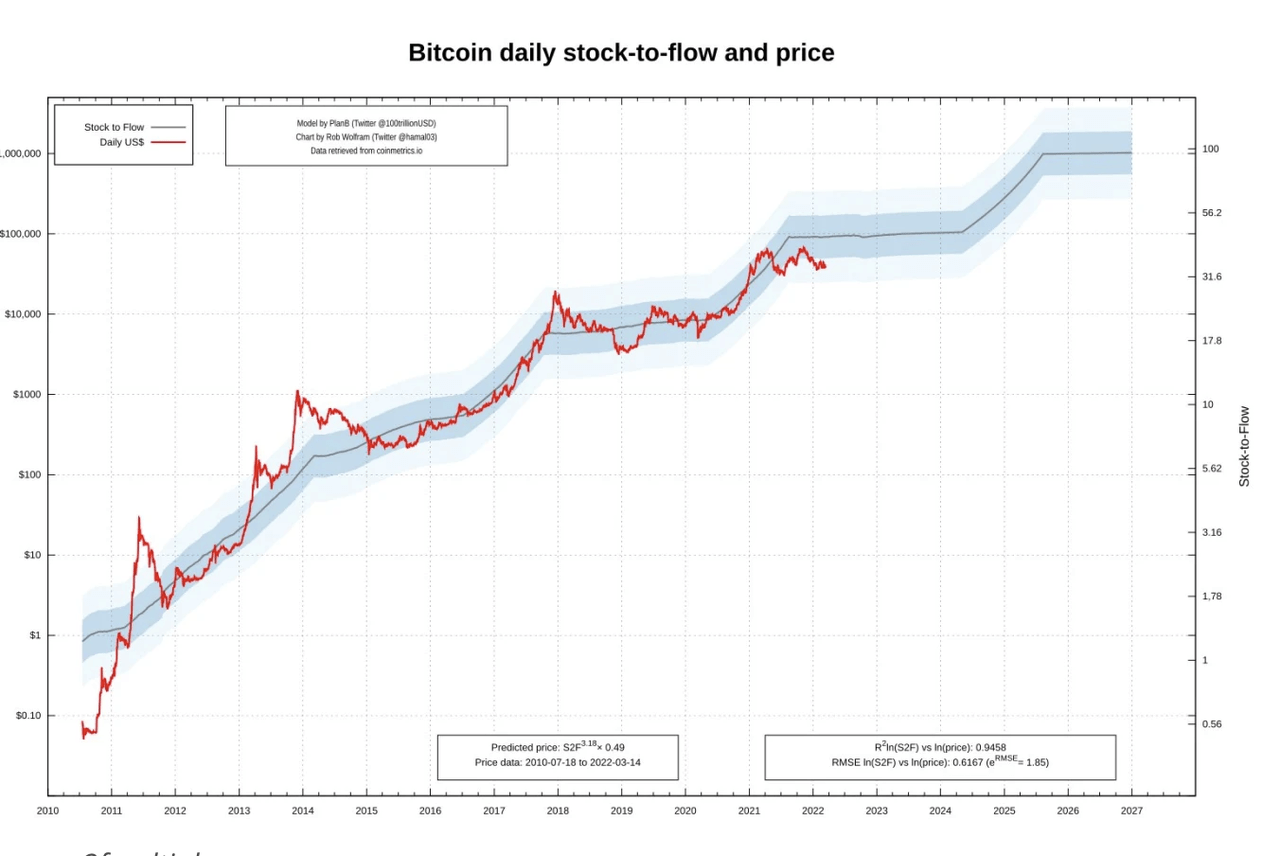
The stock-to-flow model (S2F model) is a popular pricing model for Bitcoin. We can see it below.

S2F model (S2Fmultiple)
The inventory-to-flow ratio is obtained by calculating how long it will take at the current production rate (flow) to produce an amount equal to the current inventory.
For example, it is estimated that 3,000 metric tons of gold are mined each year, and that 185,000 tons of gold have already been mined in the world. This means that gold has an S2F ratio of 62.
Now, if we calculate the S2F value for Bitcoin and use this mathematical formula shown in the box, we get a projection of the price of Bitcoin which is shown in the red line in the chart.
Notice how the value of Bitcoin using this model increases over time as more Bitcoin halvings take place. This is because halving events reduce the production capacity of Bitcoin, which increases the S2F ratio.
Since its inception, Bitcoin’s price has fluctuated around the predicted price of the S2F model, although the current price is quite far from the model’s target price for today, which should be around $112,000.
In any case, if this model is accurate, after the next halving, Bitcoin should reach a price of $1.285 million, and this will happen sometime around 2025.
Technical Line Up
We can also reach a target price for Bitcoin using Elliott Wave Theory. However, I must say that there are different ways to calculate price targets and these estimates are not completely reliable.

Bitcoin price analysis (Author’s work)
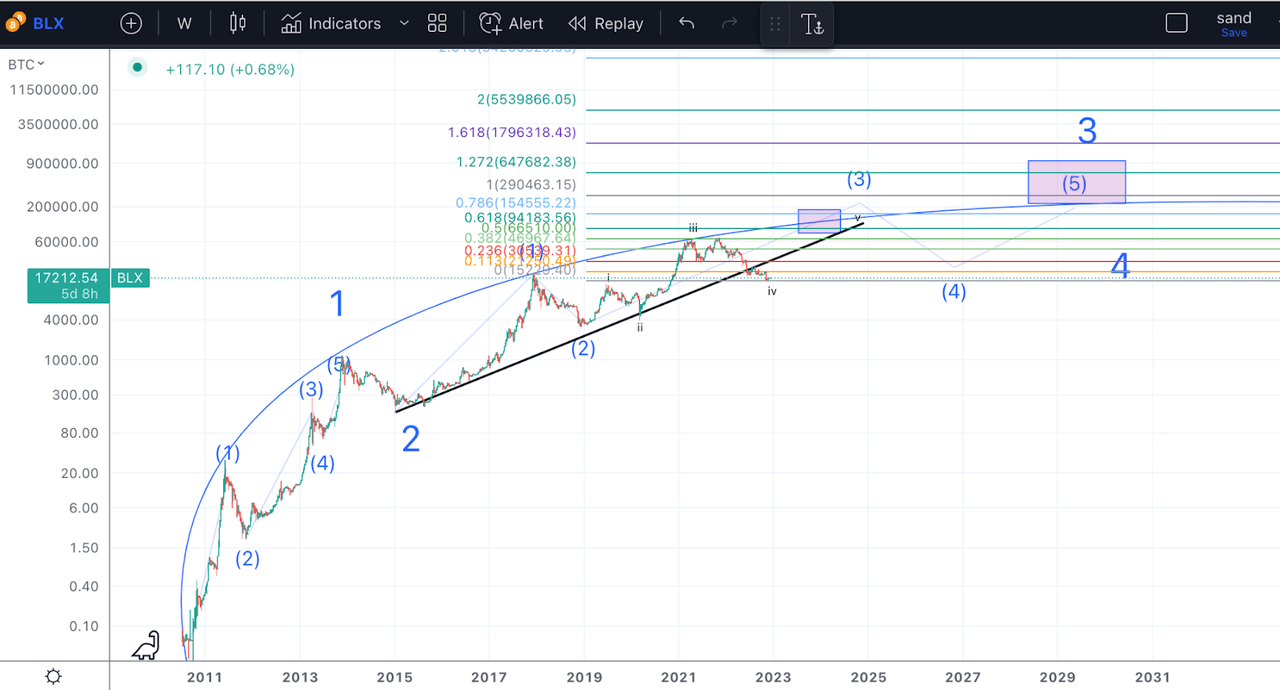
The chart above shows a potential long term count for Bitcoin. We have an initial five-wave move up in 2014, which is a large degree wave 1. The bear market of 2015 was our wave 2. The following rally, which led to the 2018 peak, was wave 1 of a five-wave structure of our major-degree wave 3. Now we are currently completing another five-wave structure shown in the minor Roman numerals, within a wave 3 within the major 3.
Last year’s bear market was part of a wave iv, which may still be ongoing. However, let’s assume that Bitcoin has found a bottom around the $15K mark. We can now project the length of wave v of 3, and from there, with some additional assumptions, we can project the following waves 4 and the final wave 5 of 3.
So, first, there are three ways to calculate a wave 5/vi EWT.
-
Wave 5 is similar to wave 1
-
Wave 5 is equal to 61.8% of waves 1+3
-
Wave 5 is equal to the inverse 1.618 extension of wave 4
In this chart, if wave v was equal to wave i, we wouldn’t even rally above the previous high, so let’s discard that option.
If we measure the length of i+iii from the bottom of wave iv, 61.8% ext lands at a price of $94,000. This is shown on the chart above.
Finally, we can also have the inverse 1.618 ext of wave iv, which leads us to a more bullish target around $150,000.
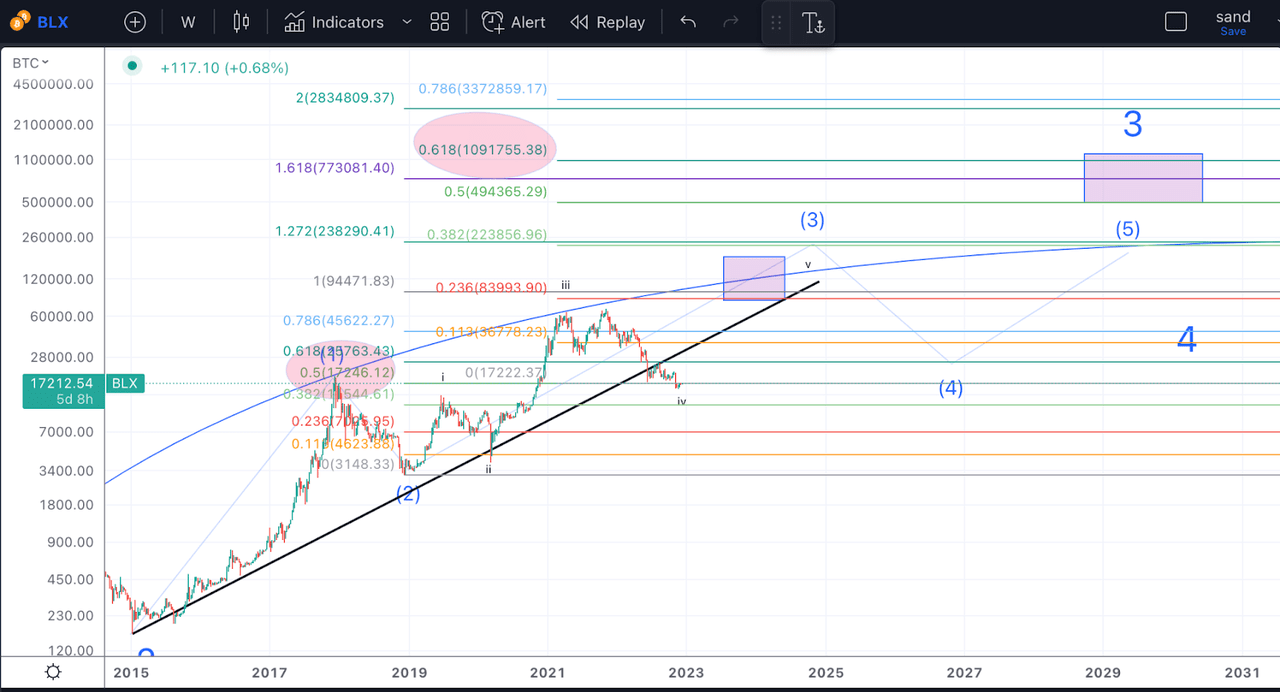
So, let’s assume that Bitcoin reaches $94,000 in wave 3. Then where would wave 4 land? The most likely outcome according to EWT would be a 50% retracement of wave 3, which lands us at $17,246.

Bitcoin price analysis (Author’s work)
In EWT it is also common for higher degree wave 4s to overlap with smaller degree wave 4s, so this price range makes a lot of sense.
If we again measure waves 1+3, (the length of the black line), from the bottom of wave 4, ($17,246), 0.618 ext should be where wave 5 lands, which is at $1.09 million.
If we took the length of wave 1 instead, we would reach a target of $1.7, and if we instead use the inverse 1.618 of wave 4, we would get a much less bullish price target of around $200,000.
Now, to calculate this accurately, we need to know exactly where the next wave 3 and 4 are going to end, but this gives us a decent idea of where we should be heading in the coming years. I expect wave 3 to take place in 2025 after the next halving. We would then enter a bear market as usual, which would be wave 4 during 2026-2028, and then we would rally again after the subsequent halving, which would mean that wave 3 could peak around 2030, which is when ARK Invest believes Bitcoin could be worth $1 million.
Final thoughts
ARK’s theory that Bitcoin could reach $1 million by 2030 is supported by the stock-to-flow model and Elliott Wave projections. However, we must understand that there are limitations to what technical analysis can do in such long time frames. Personally, I have my eyes on the next bull phase, which will see Bitcoin hit new highs, but I don’t think it will land us anywhere near $1 million.


