Bitcoin Price Analysis: BTC is slowly forming consolidation around $17,000, looks to break higher
Bitcoin price analysis shows that the bullish momentum is strengthening as the price has managed to close above the upper trendline in a large symmetrical triangle pattern. The upcoming session is expected to see a continuation of this move higher, with confirmation that bitcoin will break through the $17,200 resistance handle and test the next major hurdle at $18,000.
Bitcoin has been in a continuous upward trend for the past week, rising by over 2 percent. This shows that there is strong buying pressure in the market, which could push bitcoin higher as we enter the final month of 2022. A key level to watch out for is $16,330, which is a firm support zone for bitcoin. A break below this level could signal a reversal in price action, so traders should be alert for potential short-term selling opportunities.
Bitcoin is trading at $16,987.19 after attempting to turn $17,000 into support on December 1, and has hit its lowest monthly close in two years.
Looking ahead, we can expect the Bitcoin price to continue gaining strength in the near term as it pushes higher towards its next major resistance level of $18,000. The Fibonacci retracement tool, which measures the length of a move in terms of price and time , shows that bitcoin may test this level before retreating.
Despite this, the overall outlook for bitcoin remains positive as we head into December. The entire crypto market appears to be recovering from lost ground as the contagion risk associated with FTX’s collapse begins to unravel. Although the market cap rose 2% in the past week and an ascending channel was established on November 20, people remain pessimistic about the year-to-date losses of 63.5 percent. The November 2022 crypto winter is the worst since 2019 as the digital asset has lost over 16 percent.
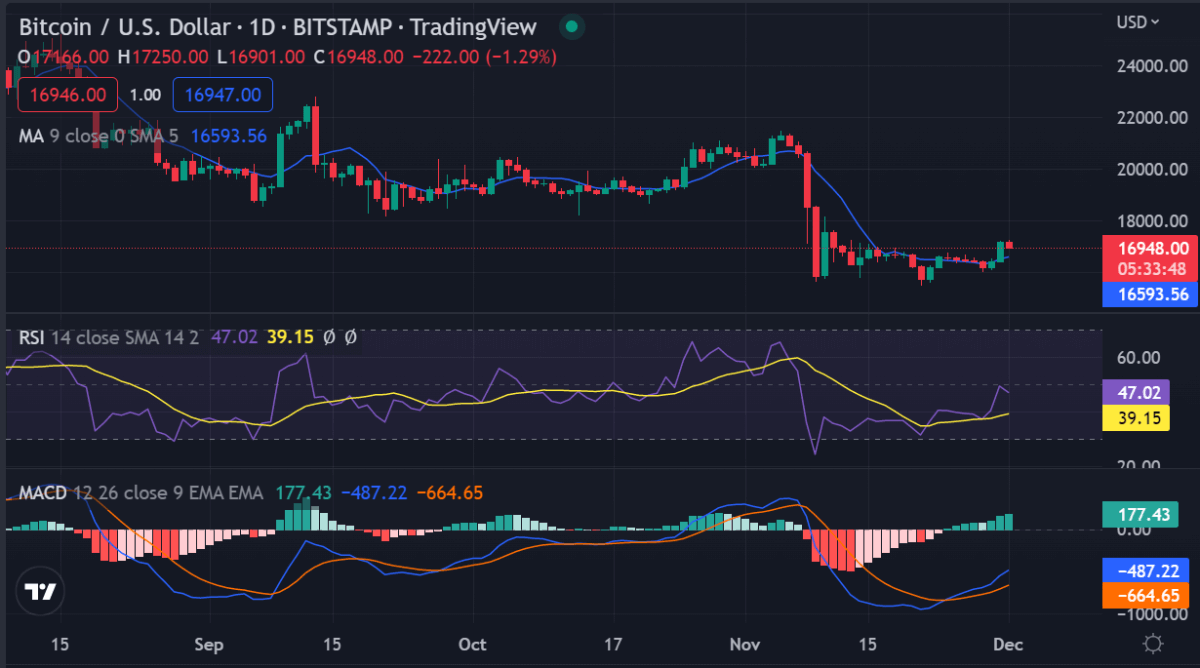
Bitcoin Price Analysis on a Daily Chart: Bulls continue to dominate the market
Bitcoin price analysis shows that Bitcoin continues to trend higher, driven by strong bullish momentum. The 100-day moving average has crossed above the 50-day moving average, indicating that the uptrend is likely to continue in the near term.
There are several key levels to watch on the chart, including support at $16,330 and resistance at $18,000. A move above this level could open the door to a test of the $20,000 handle.

The Relative Strength Index (RSI), which measures the strength of a given asset’s momentum, is currently trending lower but remains in overbought territory. This indicates that we can expect the Bitcoin price to pull back before pushing higher again, potentially retesting the $16,330 support level as it has done for the past few days.
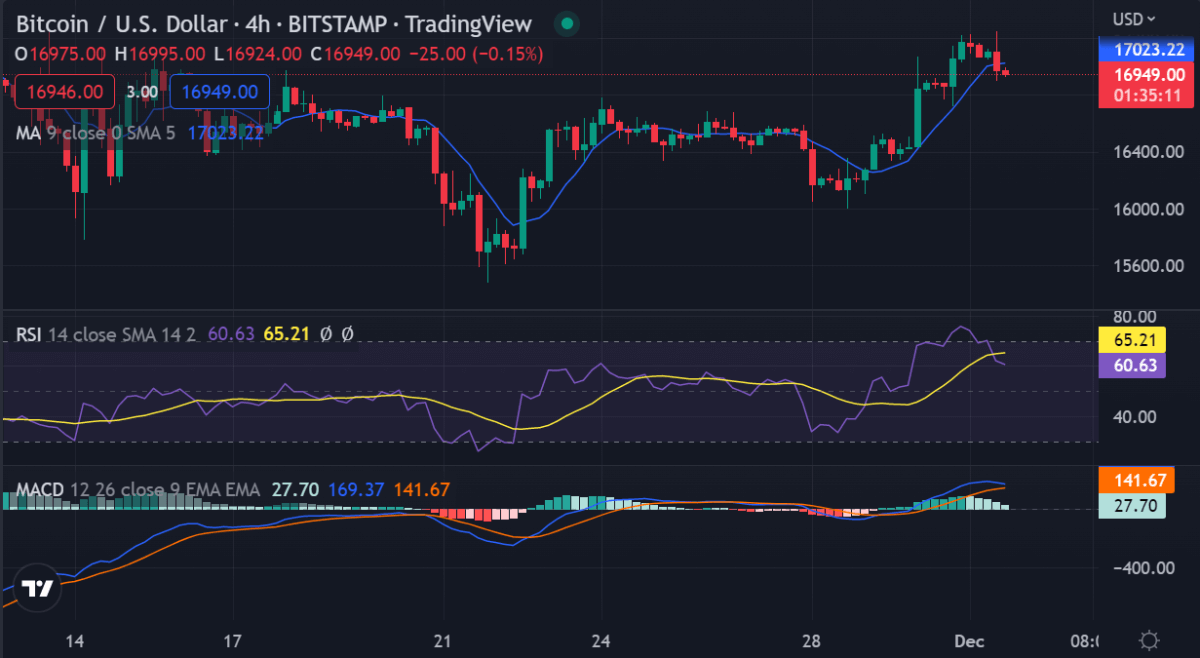
Bitcoin price analysis on a 4-hour chart: BTC consolidates around $17,000
Bitcoin price analysis shows that BTC has been trading in an upward trajectory, reaching a high of $17,197.50 on December 1st. However, price action is seen consolidating slightly below this level as traders appear to be building momentum for a move higher.

The 4-hour RSI has pulled back from overbought levels and is currently sitting in neutral territory. This suggests that we may see price action in the near term, with a break above $17,200 likely to signal another move up for bitcoin.
The moving average lines also point to a potential breakout as the 100-day moving average has crossed above the 200-day moving average, which is usually seen as a bullish sign.
Bitcoin price analysis conclusion
Bitcoin price analysis shows that bulls are still in control of this market although we have seen some consolidation in recent days and weeks. The ascending channel on the daily chart and the breakout in price action on the 4-hour charts suggest that bitcoin is poised for further gains, with a potential test of $18,000 in the cards before we see a major pullback.
While you wait for Bitcoin to move forward, check out our long-term price predictions on Chainlink, VeChain and Axie Infinity.
Disclaimer. The information provided is not trading advice. Cryptopolitan.com holds no responsibility for investments made based on the information provided on this page. We strongly recommend independent research and/or consultation with a qualified professional before making any investment decisions.


