Bitcoin Lags As ‘Fed Trade’ Winds Up Lifts US Stocks Above 200-Day Average
Unless you’ve been underwater for over a year, you probably know that selling risky assets like US stocks and bitcoin (BTC) and buying the US dollar against the Japanese yen (JPY) have been some of the most popular macro plays since the start of 2022 .
Investors have reassessed their commitment to these so-called hawkish Federal Reserve (Fed) trades in recent weeks and piled back into risk assets, excluding bitcoin, thanks to the narrative of peak inflation and the central bank hinting at moderation in liquidity tightening from December.
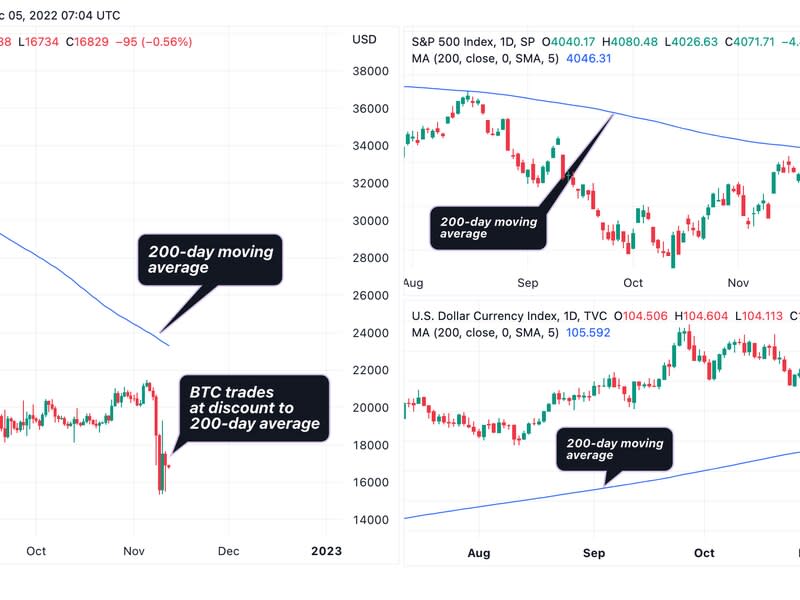
The S&P 500, Wall Street’s benchmark stock index, has risen 16% in less than two months to trade above its broadly tracked 200-day moving average for the first time since early April. The USD/JPY pair, often called a turbo bet on Fed policy and US interest rates, has fallen 11% to its 200-day moving average. The dollar index, which tracks the dollar’s value against major fiat currencies, has also fallen below its 200-day moving average.
US Treasury yields have fallen sharply from annual highs, confirming the narrative of peak inflation and the resulting rise in risk in equity and currency markets.
However, Bitcoin seems to have disconnected from macroeconomic developments and traditional markets. At press time, the leading cryptocurrency by market capitalization was changing hands at $17,340 or trading at a 22% discount to its 200-day moving average.
This shows that the FTX bankruptcy could not have come at a worse time for bitcoin and the broader crypto market.
“Historically, (US) stocks and crypto have a strong relationship with each other. Without the FTX implosion, bitcoin could have traded at $29,000 now – instead of $17,200 (or 69% higher),” Markus Thielen, head of research and strategy at crypto service provider Matrixport said.
“If the market can move on from FTX, these prices can still be achieved,” Thielen said.

Bitcoin fell to a two-year low of $15,480 last month.
The dollar index peaked and turned lower in late September, after rising nearly 20% in the first nine months of the year. Following the bearish turnaround in the dollar, the S&P 500 found a bottom in mid-October.
Diminishing effect of FTX’s insolvency
Bitcoin’s recent market activity suggests that the worst of FTX’s insolvency may be behind us. The leading cryptocurrency rose 4% last week, even as prominent crypto lender BlockFi filed for bankruptcy protection.
“There are signs that the overhang of bad news in recent weeks is having a less pronounced impact on crypto performance, although the full context of the uncertainty has not fully priced in,” Coinbase Institutional’s weekly note said, while drawing attention to the recent the moderation in the negative sentiment in the options market.
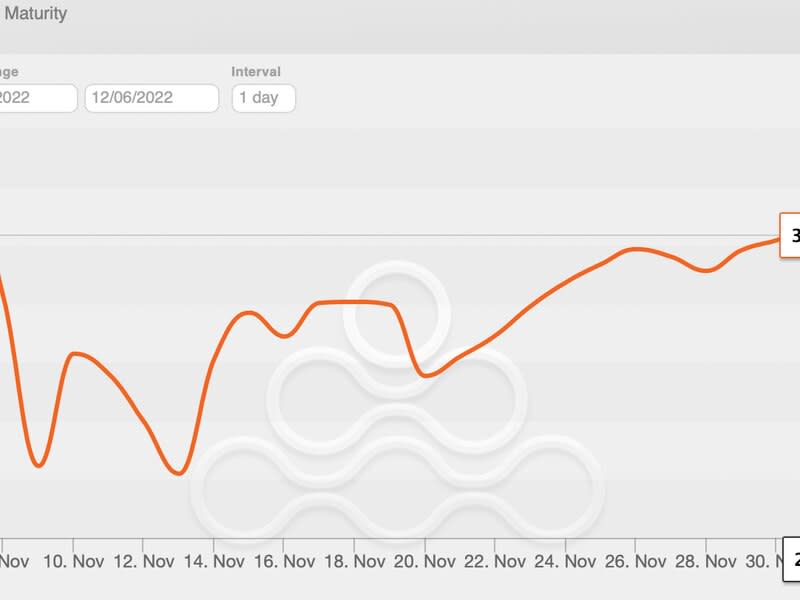
Bitcoin’s one-month call-put skew, which measures the premium investors pay for out-of-the-money (OTM) calls versus OTM puts, has jumped to -9% from -29% seen on November 13.
Put options provide protection against price crashes, while calls offer insurance against bull runs.

The recovery suggests that the height of the fear cycle has faded. Therefore, crypto investors can now focus on the improved macro backdrop and the reset of risk in traditional markets.
One question is whether the recent rise in risk in traditional markets will be long-lasting, given that the US economy is headed for recession. The situation identified by successive quarterly declines in the growth rate does not sound conducive to risk assets.

However, a recession could turn out to be a blessing in disguise, according to an analysis by macro trader Geo Chen.
“The Fed is tightening into a recession that has probably already started, and this is likely to result in a downward trend in inflation that will be more persistent than many expect,” Chen said in a Substack post published on Nov. 22.
“The biggest driver of asset prices this year has been interest rates and inflation, so a downward trend in interest rates should be a tailwind for asset prices and make next year look like this year’s mirror image,” Chen added.


