Bitcoin, Ethereum, Solana Price Analysis
Bitcoin Analysis
Bitcoin’s price closed at its highest level since June 12 on Wednesday, and when traders settled at 12:00 UTC, BTC’s price was +$817.8.
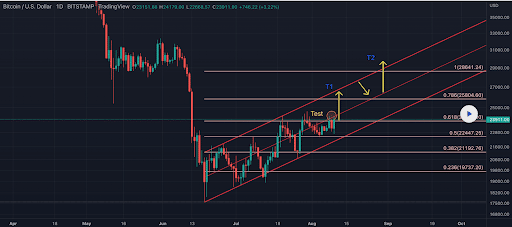
The first chart we look at today is BTC/USD 1D Chart below from gold crypto7. BTC’s price trades between the 0.5 fibonacci level [$22,447.25] and 0.618 [$23,776.00]at the time of writing.
Bullish BTC traders has target overhead of 0.618, 0.786 [$25,804.6]and 1 [$28,641.24].
Opposite the goals of the downside for bearish traders is the 0.5 fib level, followed by 0.382 [$21,192.76]and 0.236 [$19,737.2].

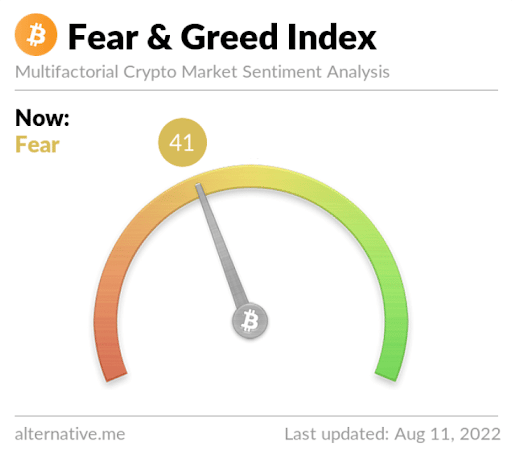
The fear and greed index is 41 Fear and is +10 from Wednesday’s reading of 31 Fear.

Bitcoin’s Moving Average: 5-day [$23,171.83]20 days [$22,728.69]50 days [$22,826.16]100 days [$30,121.43]200 days [$38,360.86]Year to date [$34,066.2].
BTC’s 24-hour price range is $22,650-$24,227 and its 7-day price range is $22,526-$24,227. Bitcoin’s 52-week price range is $17,611-$69,044.
The price of Bitcoin on this date last year was $45,546.
The average price of BTC for the last 30 days is $22,358.5 and its +9.7% over the same duration.
Bitcoin’s price [+3.53%] closed its daily candle worth $23,963.8 and in the green for the third time in the last four days.
Ethereum analysis
Ether price was the top performer of today’s assets and ended its daily session +$150.62.
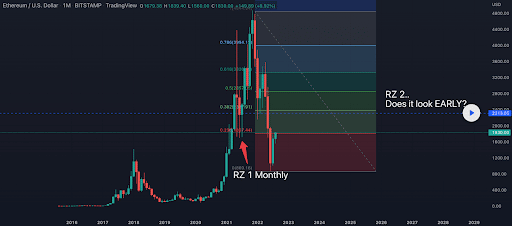
Today’s second chart for analysis is ETH/USD 1W Chart under WillSebastian. Ether’s price trades between 0.236 [$1,807.44] and 0.382 [$2,387.91]at the time of writing.
ETH’s price is bumping up against resistance at 0.236 and bullish traders are looking to eclipse that level before the monthly candle closes to signal to market participants that further upside could be coming.
Above the 0.382 fib level, targets to the upside on ETH are 0.5 [$2,857.05]and 0.618 [$3,326.19].
Those short the Ether market are looking to push ETH’s price back below 0.236 with a secondary target and a full retracement of 0 [$869.44].

Ether’s Moving Average: 5-day [$1,694.71]20 days [$1,575.15]50 days [$1,404.85]100 days [$2,046.97]200 days [$2,752.68]Year to date [$2,360.70].
ETH’s 24-hour price range is $1,656.78-$1,885 and its 7-day price range is $1,592.48-$1,885. Ether’s 52-week price range is $883.62-$4,878.
The price of ETH on this date in 2021 was $3,162.71.
The average price of ETH for the last 30 days is $1,522.21 and its +49.79% over the same time frame.
Ether price [+8.85%] closed its daily candle on Wednesday at a value of $1,853.42 and with green digits also for the third time in four days.
Solana Analysis
Solana’s price also marked on Wednesday to pull off the hat-trick for today’s asset and SOL’s price completed +$2.1 for his daily session.
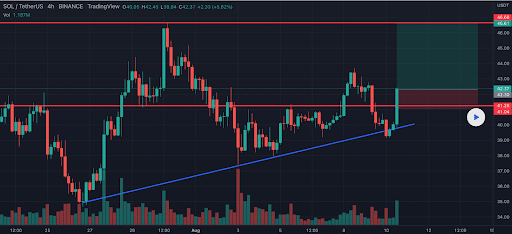
The last chart we analyze today is SOL/USD 4HR Chart below from Cryptobees_buzz. SOL’s price is trading above an important level on the 4HR chart at $41.25 and is trying to reverse the $42.37 level to support, at the time of writing.
If bulls can eclipse that level, the top of that range is $46.91 and a break above that price will encourage bulls to aim further towards the $50 level.
Unlike bulls, bearish traders are looking to break a fairly long trend line dating back to July on the 4HR chart below. To break this trend line, bearish SOL traders need to send SOL’s price below $39.76.

Solana’s moving average: 5-day [$40.73]20 days [$40.6]50 days [$37.73]100 days [$61.58]200 days [$104.32]Year to date [$78.33].
Solana’s 24-hour price range is $39.15-$42.87 and its 7-day price range is $38.32-$43.32. SOL’s 52-week price range is $25.97-$259.96.
Solana’s price on this date last year was $41.66.
The average price of SOL in the last 30 days is $39.8 and its +8.8% over the same period.
Solana’s price [+5.2%] ended its daily trade on Wednesday worth $42.45 and SOL’s also ended in the green three of the last four days.


