Bitcoin, Ethereum, Litecoin Price Analysis
Bitcoin Analysis
Bitcoin’s price took a step back on Wednesday and when traders ended the daily session, BTC’s price was -$252.
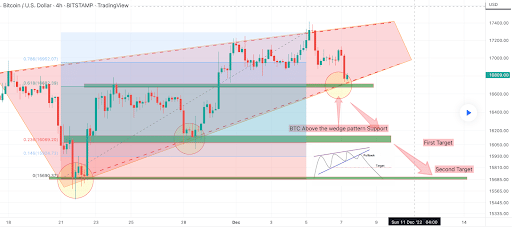
The first chart we look at today is BTC/USD 4HR Chart below from bOnchain. At the time of writing, BTC’s price is trading between the 0.618 Fibonacci level [$16,682.39] and 0.786 [$16,952.07].
If bullish traders can regain the 0.786 fibonacci level their next objective is to break out of the current wedge pattern that BTC’s price is trading within at the $17,366.87 level.
Bearish BTC traders is contrary to the bullish and hopes to break out of the wedge pattern to the downside and short BTC’s price outside the pattern and below the $16,739.31 level. Below that level, the short BTC markets have targets at 0.618, 0.236 [$16,069.20]0.146 [$15,924.73]and a full return at 0 [$15,690.37].

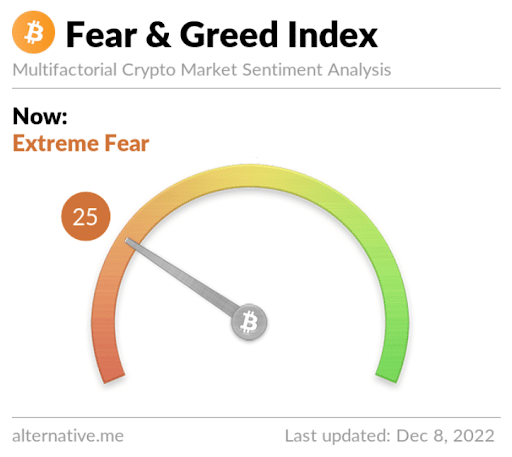
The fear and greed index is 25 Extreme fear and is -4 from Wednesday’s reading of 29 Fear.

Bitcoin’s moving average: 5 days [$16,949.63]20 days [$16,676.13]50 days [$18,464.16]100 days [$19,947.33]200 days [$26,339.56]Year to date [$28,939.43].
BTC’s 24-hour price range is $16,701-$17,156 and its 7-day price range is $16,701-$17,362.29. Bitcoin’s 52-week price range is $15,501-$52,027.
The price of bitcoin on this date last year was $50,503.4.
The average price of BTC for the last 30 days is $16,988 and its -21% over the same stretch.
Bitcoin’s price [-1.47%] closed its daily candle worth $16,844 on Wednesday.
Ethereum Price Analysis
Ether price also marked down on Wednesday and ended its daily trading session at -$40.22.
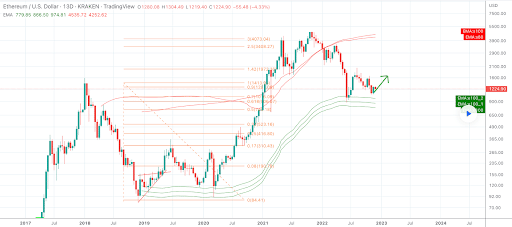
The ETH/USD 13D Chart via Cryptoer_Lion is the second chart we analyze for this Thursday. Ether’s price trades between the 0.7 Fibonacci level [$1,015.09] and the 0.9 fib level [$1,281.00], at the time of writing.
The overhead targets on ETH for bullish traders who thinks the upside is next is 0.9, 1 [$1,413.96]1.42 [$1,972.36]2.5 [$3,408.27]and the 3 fibonacci level [$4,073.04].
Conversely, those still shorting the ETH market have a primary target at the 0.7 fib level with targets below that level at 0.618 [$906.07]0.5 [$749.18]0.33 [$523.16]0.25 [$416.80]0.17 [$310.43]0.08 [$190.78]and a full retracement of 0 [$84.41].

Ether’s moving average: 5 days [$1,263.07]20 days [$1,223.74]50 days [$1,324.08]100 days [$1,465.85]200 days [$1,838.50]Year to date [$2,037.35].
ETH’s 24-hour price range is $1,218.01-$1,278.69 and its 7-day price range is $1,218.01-$1,302.22. Ether’s 52-week price range is $883.62-$4482.76.
The price of ETH on this date in 2021 was $4,435.24.
The average price of ETH for the last 30 days is $1,246.47 and its -24.07% for the same interval.
Ether price [-3.16%] ended its daily session on Wednesday worth $1,231.03
Litecoin Price Analysis
Litecoin’s price trailed the macro cryptocurrency sector on Wednesday, and as traders settled at the daily session’s close, LTC’s price was -$3.05.
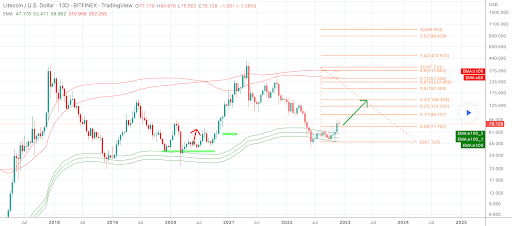
The LTC/USD 13D Chart below from Cryptoer_Lion is the final chart for analysis this Thursday. LTC’s price trades between the 0.08 fibonacci level [$71.152] and 0.17 fib level [$98.207]at the time of writing.
The overhead targets for bullish traders in Litecoin’s market are 0.17, 0.25 [$122.255]0.33 [$146.304]0.5 [$197.408]0.618 [$232.880]0.7 [$257.530]0.9 [$317.652]and the 1 fib level [$347.713].
Bearish LTC traders are targeting the downside of 0.8 and a full retracement of the 0 fib level [$47.103].

Litecoin’s 24-hour price range is $75.5-$80.4 and its 7-day price range is $75.5-$83.68. LTC’s 52-week price range is $40.4-$167.1.
Litecoin’s price on this date last year was $165.00.
The average price of LTC in the last 30 days is $68.6 and its +10.75% over the same interval.
Litecoin’s price [-3.82%] closed its daily candle on Wednesday worth $76.85 and in the red for the second day in a row.


