Bitcoin, Ethereum and XRP losses on Wednesday
Bitcoin Analysis
Bitcoin’s price was again inflicted on Wednesday following news from Federal Reserve Chairman Jerome Powell that a third consecutive rate hike of 0.75 percentage points has been given the green light and is imminent. Following the news, when traders settled at BTC’s session close on Wednesday, BTC’s price was -$385.5.
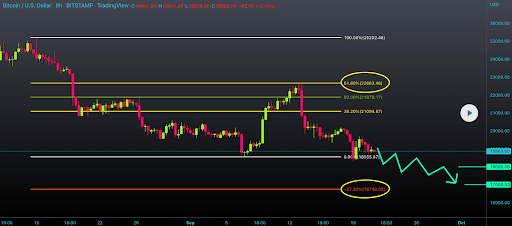
The BTC/USD 8HR Chart from Alex_master_forex is the first chart we examine for this Thursday. BTC’s price trades between 0.00% [$18,555.87] and 38.20% [$21,094.87]at the time of writing.
The goals of BTC for bullish market participants to the upside of the 8HR chart is 38.20%, 50.00% [$21,879.17]61.80% [$22,663.46]and 100.00% [$25,202.46].
Bearish traders taking reverse aim at the 0.00% fib level with a secondary target of $17,611 [BTC’s 12-month low]. If bearish traders can send BTC’s price to a new 2022 low, their next target is -27.20% [$16,748.00].

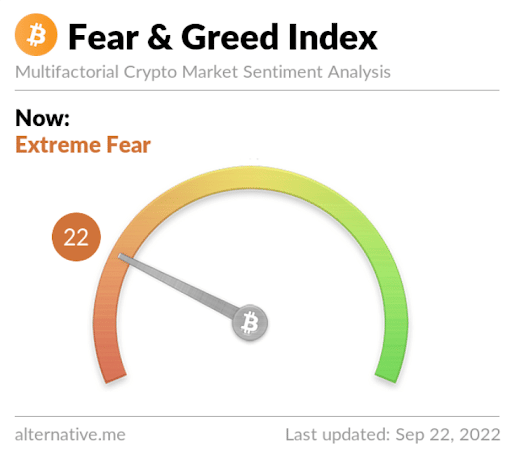
The fear and greed index is 22 Extreme fear and is -1 from Wednesday’s reading of 23 Extreme Fear.

Bitcoin’s Moving Average: 5-day [$19,461.81]20 days [$20,069.52]50 days [$21,712.35]100 days [$23,814.81]200 days [$32,973.89]Year to date [$31,986.72].
BTC’s 24-hour price range is $18,126-$19,956 and its 7-day price range is $18,126-$20,201.58. Bitcoin’s 52-week price range is $17,611-$69,044.
The price of Bitcoin on this date last year was $43,536.1.
The average price of BTC for the last 30 days is $20,300.2 and its -7.6% over the same time frame.
Bitcoin’s price [-2.04%] closed its daily candle on Wednesday worth $18,489.3 and in the red for the third time in the last four days.
Ethereum analysis
Ether price has lost 20.8% of its value over the past 30 days, and Wednesday saw another sharp decline in ETH’s price. As traders ended trading for Wednesday’s daily session, ETH’s price was -$75.42.
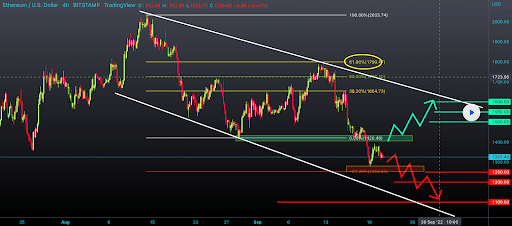
The ETH/USD 4HR Chart of Alex_master_forex is the second chart we look at today. ETH’s price is trading between -27.20% fibonacci level [$1,253.64] and 0.00% [$1,420.46]at the time of writing.
If bullish Ether traders can regain the 0.00% fib level, their targets shift to 38.20% [$1,654.73]50.00% [$1,797.1]61.80% [$1,799.47]and 100.00% [$2,033.74].
Bearish ETH traders looking to break the -27.20% fib level before Ether’s price is sent back to triple digits.

Ether’s Moving Average: 5-day [$1,397.37]20 days [$1,560.25]50 days [$1,615.77]100 days [$1,608.15]200 days [$2,346.85]Year to date [$2,246.15].
ETH’s 24-hour price range is $1,220-$1,408.9 and its 7-day price range is $1,220-$1,634.95. Ether’s 52-week price range is $883.62-$4,878.
The price of ETH on this date in 2021 was $3,077.76.
The average price of ETH for the last 30 days is $1,562.88.
Ether price [-5.70%] ended its daily session on Wednesday at a value of $1,247.9 and in the red for the third time over the last four daily candles as well.
XRP analysis
XRP’s price also retreated more than 5% on Wednesday, ending its daily session at $-0.0208.
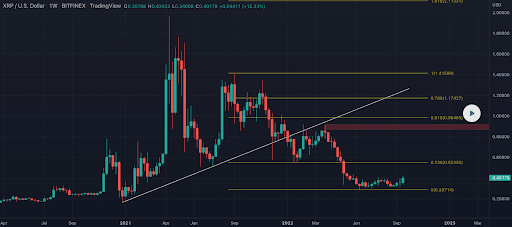
The last chart we analyze for this Thursday is XRP/USD 1W Chart below from crytobullmike. Ripple’s price trades between the 0 fib level [$0.28714] and 0.236 [$0.55350]at the time of writing.
The above goals for bullish XRP traders are 0.236, 0.618 [$0.98465]0.786 [$1.17427]and 1 [$1.41580].
Bearish traders has a target of a full retracement on the weekly time scale for XRP, which is to send the price back to the $0.28 level before sending it to a new 52-week low.

XRP’s Moving Average: 5-day [$0.37]20 days [$0.344]50 days [$0.355]100 days [$0.368]200 days [$0.565]Year to date [$0.544].
Ripple’s 24-hour price range is $0.38-$0.434 and its 7-day price range is $0.324-$0.434. XRP’s 52-week price range is $0.2876-$1.3462.
Ripple’s price on this date last year was $1.00.
The average price of XRP in the last 30 days is $0.34608 and its +17.53% in the same period.
XRP’s price [-5.01%] closed its daily candle on Wednesday worth $0.394 and in the red for the first time in three days.


