Bitcoin Poised To Increase To $56K As Nasdaq Breaks Out Of Bull Flag, Chart Analyst Says
Join the most important conversation in crypto and web3! Secure your place today
“Based on the first law of physics, an object in motion will continue to move until an external force affects it,” Wall Street master trader Martin S. (Buzzy) Schwartz wrote in his book “Pit Bull.”
Bitcoin (BTC) has rallied nearly 50% in the first seven weeks of the year, hitting a six-month high of $24,900, with external forces such as sentiment in traditional markets largely supportive. Recently, the crypto market and Wall Street’s tech-heavy Nasdaq index have grown resistant to the Federal Reserve’s anxiety and the resulting rise in Treasury yields.
So one chart analyst expects a continued move higher that could see bitcoin more than double in value in the coming months.
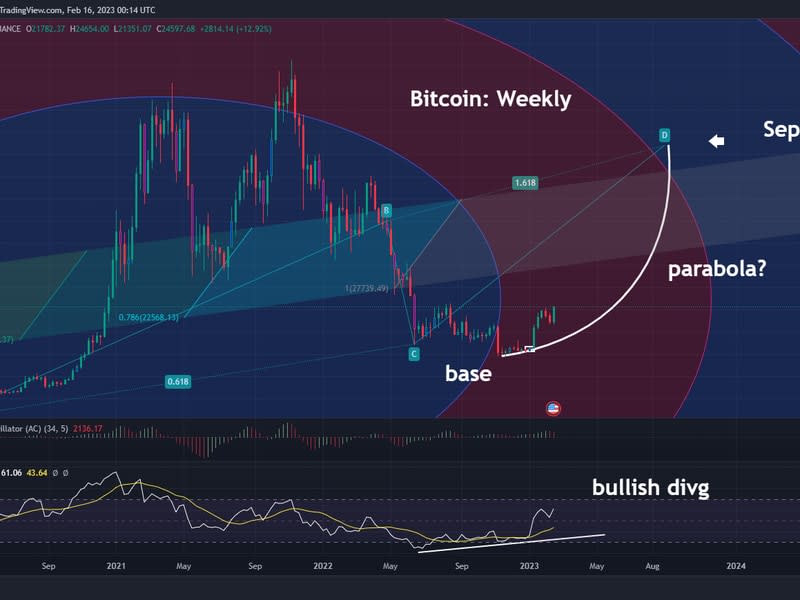
“Bitcoin is breaking out of a long base formation. There’s a saying, the bigger the base, the higher up in space,” William Noble, director of research at Emerging Assets Group and a former analyst at Goldman Sachs and Morgan Stanley, told CoinDesk.
“Bitcoin could go from consolidation to another parabolic move back to $56,000,” Noble said, after predicting the cryptocurrency’s late-2020 rise from $20,000 to $40,000.
“Going parabolic” is an expression often used in the crypto market to describe an expected impulsive move higher with limited downticks.

Bitcoin’s recent bull revival follows a prolonged period of sideways trading at the depths of the bear market around $18,000, or the base pattern, as Noble said.
The widely tracked momentum indicator relative strength index (RSI) has diverged bullishly on the weekly chart, confirming the end of the downtrend.
A bullish divergence of the RSI occurs when the indicator does not retrace the new low price, as observed in November 2022. It is a sign that bears are losing power and bulls are gaining strength.
Nasdaq’s bull flag
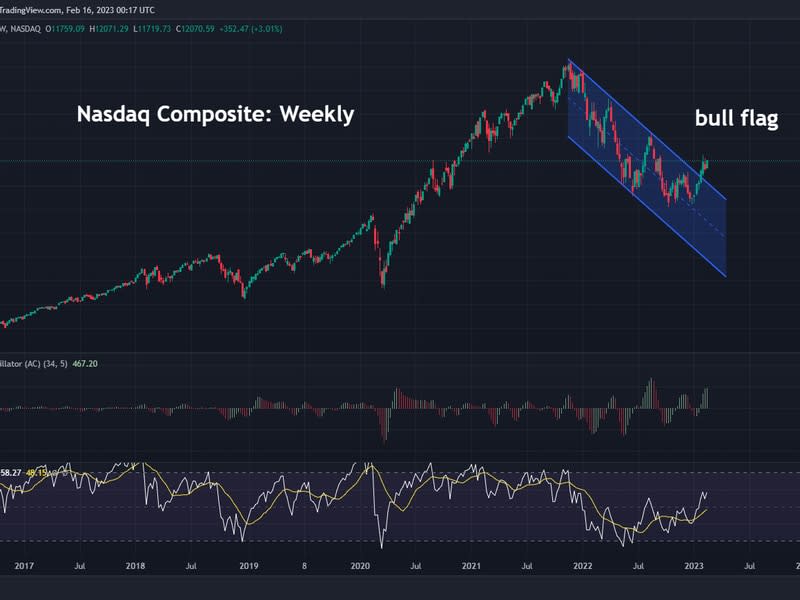
Another good news for crypto bulls is that the Nasdaq has broken out of a bull flag, a technical pattern known to accelerate an uptrend. Bitcoin’s 90-day correlation coefficient with the Nasdaq has increased to 0.75, indicating that the two assets are moving in sync.
“In the Nasdaq, there’s a bull flag. There’s a saying that says ‘flags are flying at half-mast,’ which means there could be another big rally in stocks to a new all-time high,” Noble said.

A bull flag is formed when a correction follows an initial steep rise. An eventual breakout from the flag is said to confirm a resumption of the broader uptrend.
The Nasdaq fell 37% in the 11 months to October 2022. Although the decline was severe, it looked like a correction in the broader rally from March 2020 lows and represented a flag pattern on the weekly chart that recently ended with a bullish breakout .
“Put differently, there could be a new bull market in stocks that looks like the last bull market; 2023 could be a surprisingly good year for both crypto and stocks,” noted Noble.
Interestingly, the Nasdaq daily chart also shows a bull flag breakout, as popular analyst Declan Fallon noted.
Potential eruption in ether

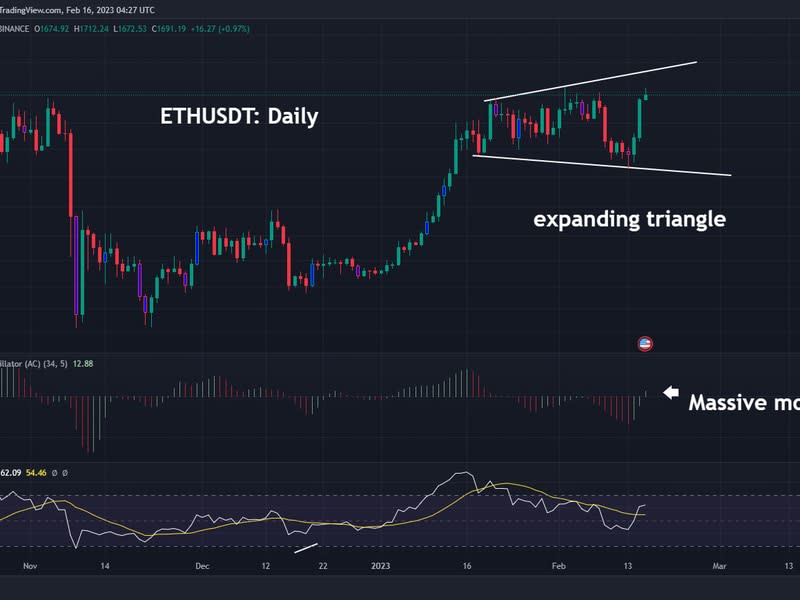
Ether (ETH), the second-largest cryptocurrency by market cap, has yet to break out of an expanding triangle, identified by trend lines connecting the January 21 and February 2 highs and lows recorded on January 25 and February 13.
Per Noble, a potential breakout could bring big gains in Ethereum’s native token.
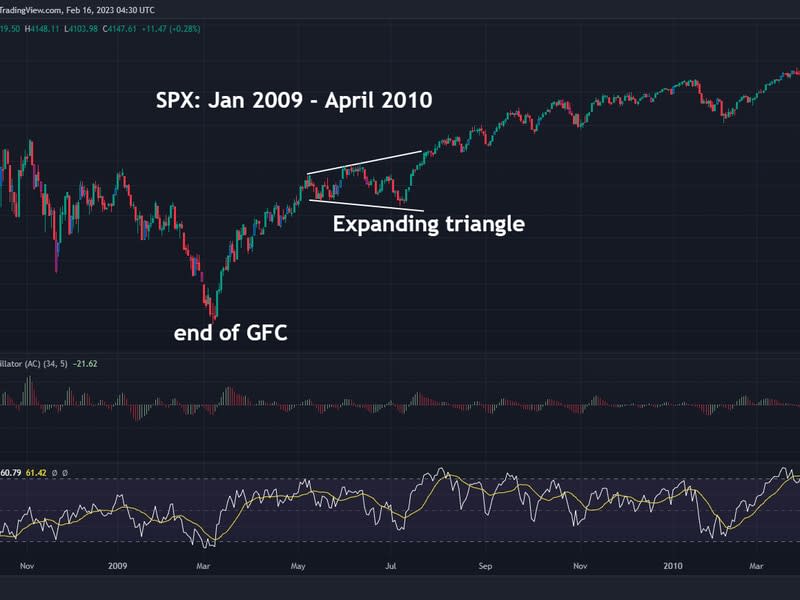
“The expanding triangle in ETH is potentially very bullish. I saw formations like this in 2009 and 2010 when stocks rallied after the global financial crisis,” Noble said, pointing to the S&P 500’s 2009 expanding triangle breakout.


