Bitcoin Price Analysis: Bearish curve dominates as BTC falls to $16,829
The Bitcoin price analysis reveals that the cryptocurrency continues its decline again after a single day of recovery. Bitcoin covered a downward range since December 14, 2022, but found support at $16,803 today. The recovery process lasted only one day and selling pressure has re-emerged as the price is falling today. Bears have brought the price down to $16,829 and the cryptocurrency price may go further down and it may retest the $16,803 level.
BTC/USD 1-Day Price Chart: Support for the coin is also present nearby
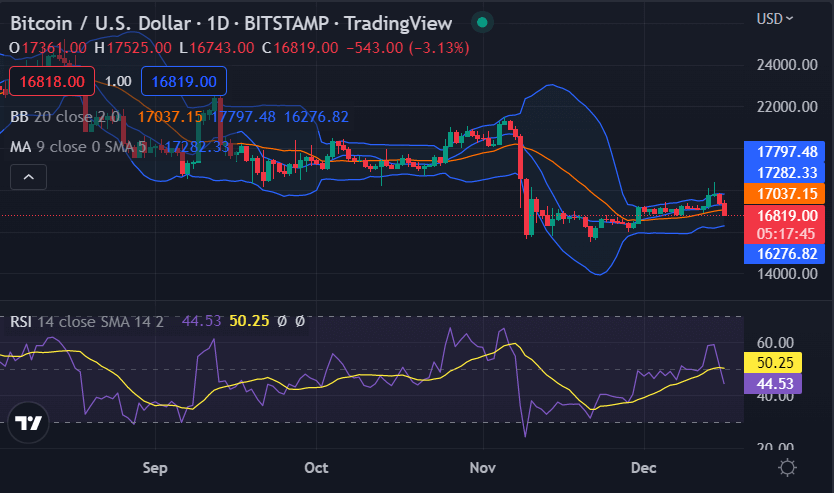
The 1-day Bitcoin price analysis shows that a further decline in price has been noted again today as the price has devalued to $16,829 at the time of writing. BTC is showing a loss in price value of 3.44 percent, which may increase over time as price levels continue to decline. However, support is also present near $16,803, which is the first line of defense for bulls, followed by stronger resistance at $17,505, so the coin may find support in the coming hours. The market value has also decreased by 3.47 percent, and the trading volume is also down by 10.8 percent today.

Volatility for BTC has increased slightly, as well as the Bollinger Bands have diverged slightly. Now, the upper band is at $17,505, which represents resistance for the coin’s price function, and the lower band is at $16,803, which represents support for the crypto pair. The moving average (MA) is trading above the price level at the $17,282 mark.
Bitcoin Price Analysis: Bearish spell devalues BTC to $17,505
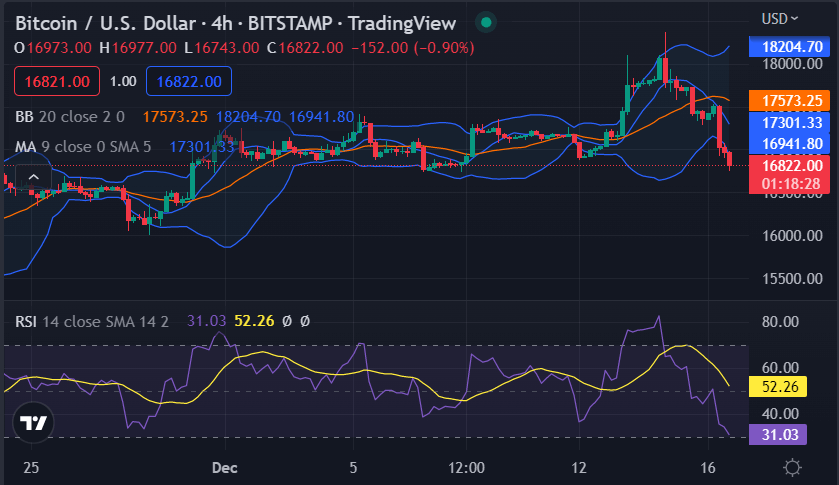
The four-hour Bitcoin price analysis gives a strong bearish indication as the bearish momentum gets stronger with each passing hour. Although there have been variations and fluctuations in the price trends due to bullish attempts yesterday, the last four hours have still turned out to be favorable for the bears. At the moment, the price has lowered to $17,505 of figures and further losses are also possible if the selling pressure continues. The moving average value of the four-hour price chart is found to be at the $17,301 level and the MA curve is also trending down.

Volatility on the 4-hour chart is also high, but now the indicator appears to be taking a downward breakout, suggesting a further loss in value in the coming hours. the upper band is at the $18,204 mark, and the lower band at the $16,941 mark. The relative strength index (RSI) has fallen since the previous day and is trading at index 52.26 in the lower half of the neutral zone. The downward curve of the RSI indicates the selling pressure and selling activity currently taking place in the market.
Bitcoin price analysis conclusion
The Bitcoin price analysis suggests that the price will fall further today as the entire market is under a bearish spell. The BTC/USD crypto pair has already gone through extreme losses at the start of the trading session today and it is expected that the cryptocurrency value will continue to decline in the coming hours. But we expect the decline to be of a controlled nature.
While you wait for Bitcoin to move forward, check out our price estimates on XDC, Cardano and Curve.


