Bitcoin Puell Multiple Continues Uptrend, Here’s What History Says Could Happen Next
On-chain data shows that the Bitcoin Puell Multiple has risen recently after forming a possible bottom. Here’s what history says could happen next for the crypto price.
The Bitcoin Puell Multiple 100MA has bounced off a potential cycle bottom
As pointed out by an analyst in a CryptoQuant post, BTC miners seem to be betting on a price increase as they have aggressively increased their hash rate recently.
“Puell Multiple” is an indicator that measures the ratio between current mining revenue (in USD) and the 365 day moving average of the same.
What this calculation tells us is how much miners are earning right now compared to the average for the past twelve months.
Now, here is a chart showing the trend of the 100-day moving average Bitcoin Puell Multiple over the past few years:
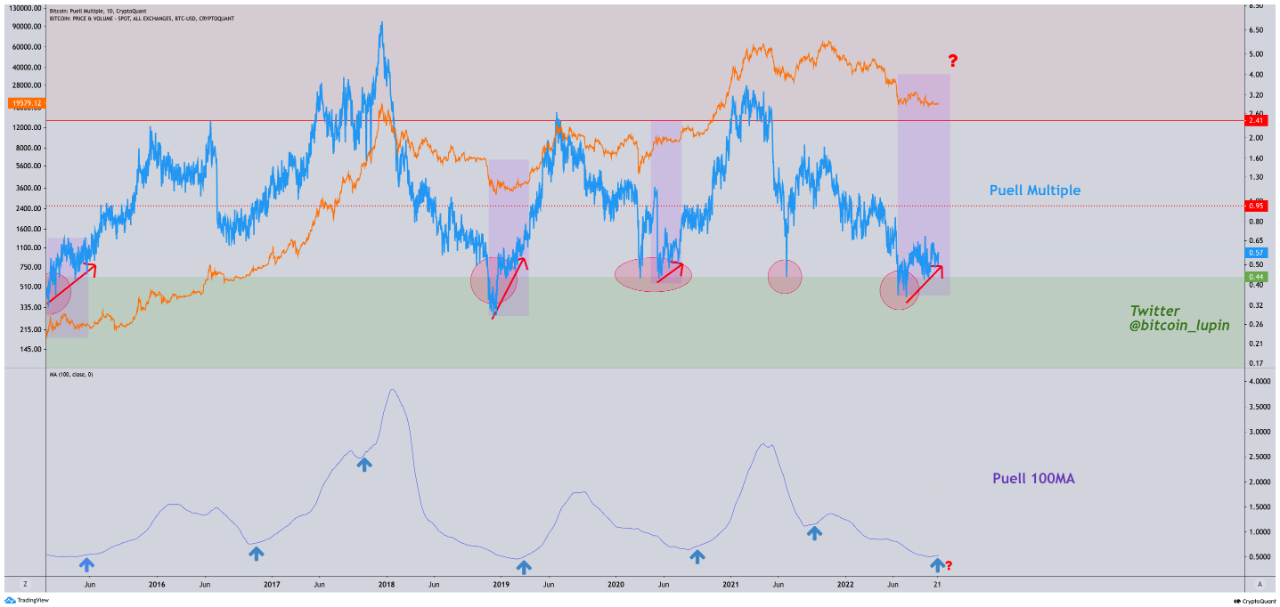
The 100-day MA value of the metric seems to have been trending up in recent months | Source: CryptoQuant
As you can see in the graph above, the quant has marked the relevant trend points for the 100-day MA Bitcoin Puell Multiple.
It seems that every time the indicator has bottomed below the 0.5 mark and then started to steadily rise again, the price of the crypto has followed up with a bullish trend.
A few months ago, the metric dipped into this historic bottom zone and then climbed back out of it. Since then, Multiple has followed a general upward trend.
If the historical pattern is anything to go by, this formation in the Puell Multiple could prove to be constructive for the price of Bitcoin.
The analyst also notes that the mining hash rate has shot up lately, while the value of the crypto has not gone up.
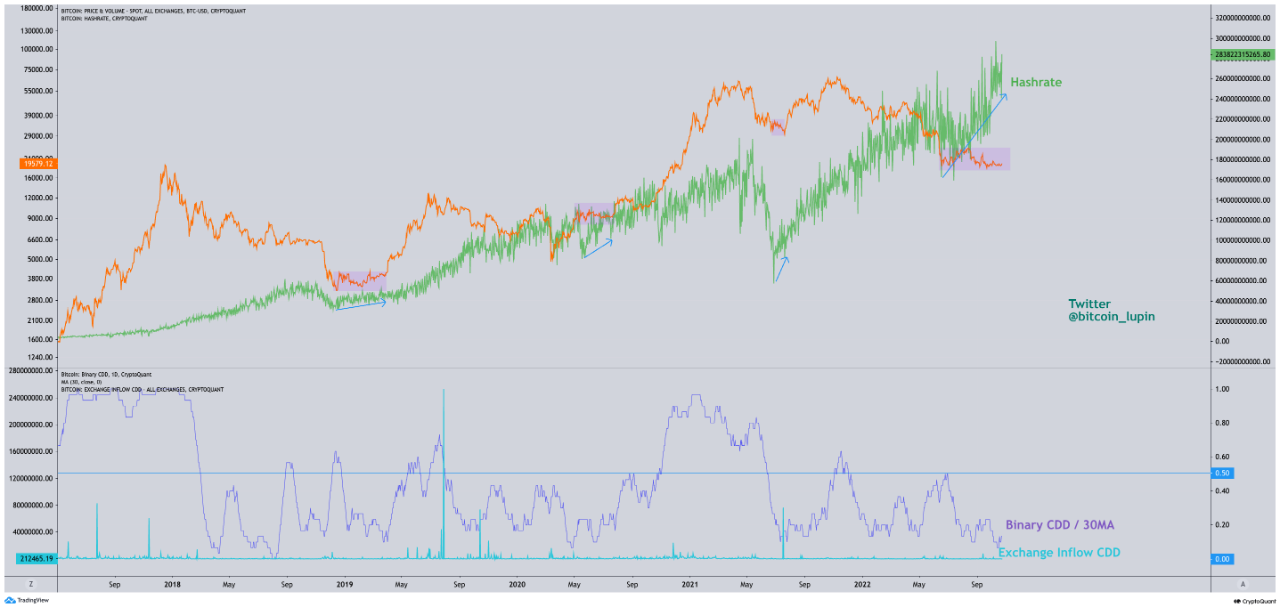
Looks like the value of the metric has set a new all-time high recently | Source: CryptoQuant
“Hashrate” is a measure of the total computing power that miners have connected to the network. They increase it during a period where the price has moved sideways, suggesting that the miners are betting that the coin’s value will go up in the long term.
BTC price
At the time of writing, Bitcoin’s price is hovering around $19.2k, down 1% in the last seven days. Over the past month, the crypto has increased 1% in value.
Below is a chart showing the trend in the price of the coin over the last five days.

The value of BTC has continued to consolidate sideways in the past few days | Source: BTCUSD on TradingView
Featured image from Thought Catalog on Unsplash.com, charts from TradingView.com, CryptoQuant.com

