BTC suggests bearish outlook amid worsening geopolitical conditions
- Bitcoin price is teetering on the edge of a bearish pattern, a breakout that could result in an 18% decline.
- Ethereum price continues to bounce between the $1,280 support level and the $1,423 resistance area.
- Ripple price is likely to retreat to $0.498 before rising 20%.
The Bitcoin price is at a turning point, a decisive move here will determine the next course of action for the crypto markets. From a point of view unbiased by BTC’s bearishness, both Ethereum and Ripple prices appear to be bouncing.
While crypto markets continue to be choppy, recent reports suggest that Russia has fired missiles targeting key infrastructure in Ukraine. President Volodymyr Zelenskyy confirms the same, adding that Russia’s other targets were people.
Bitcoin price to establish directional bias soon
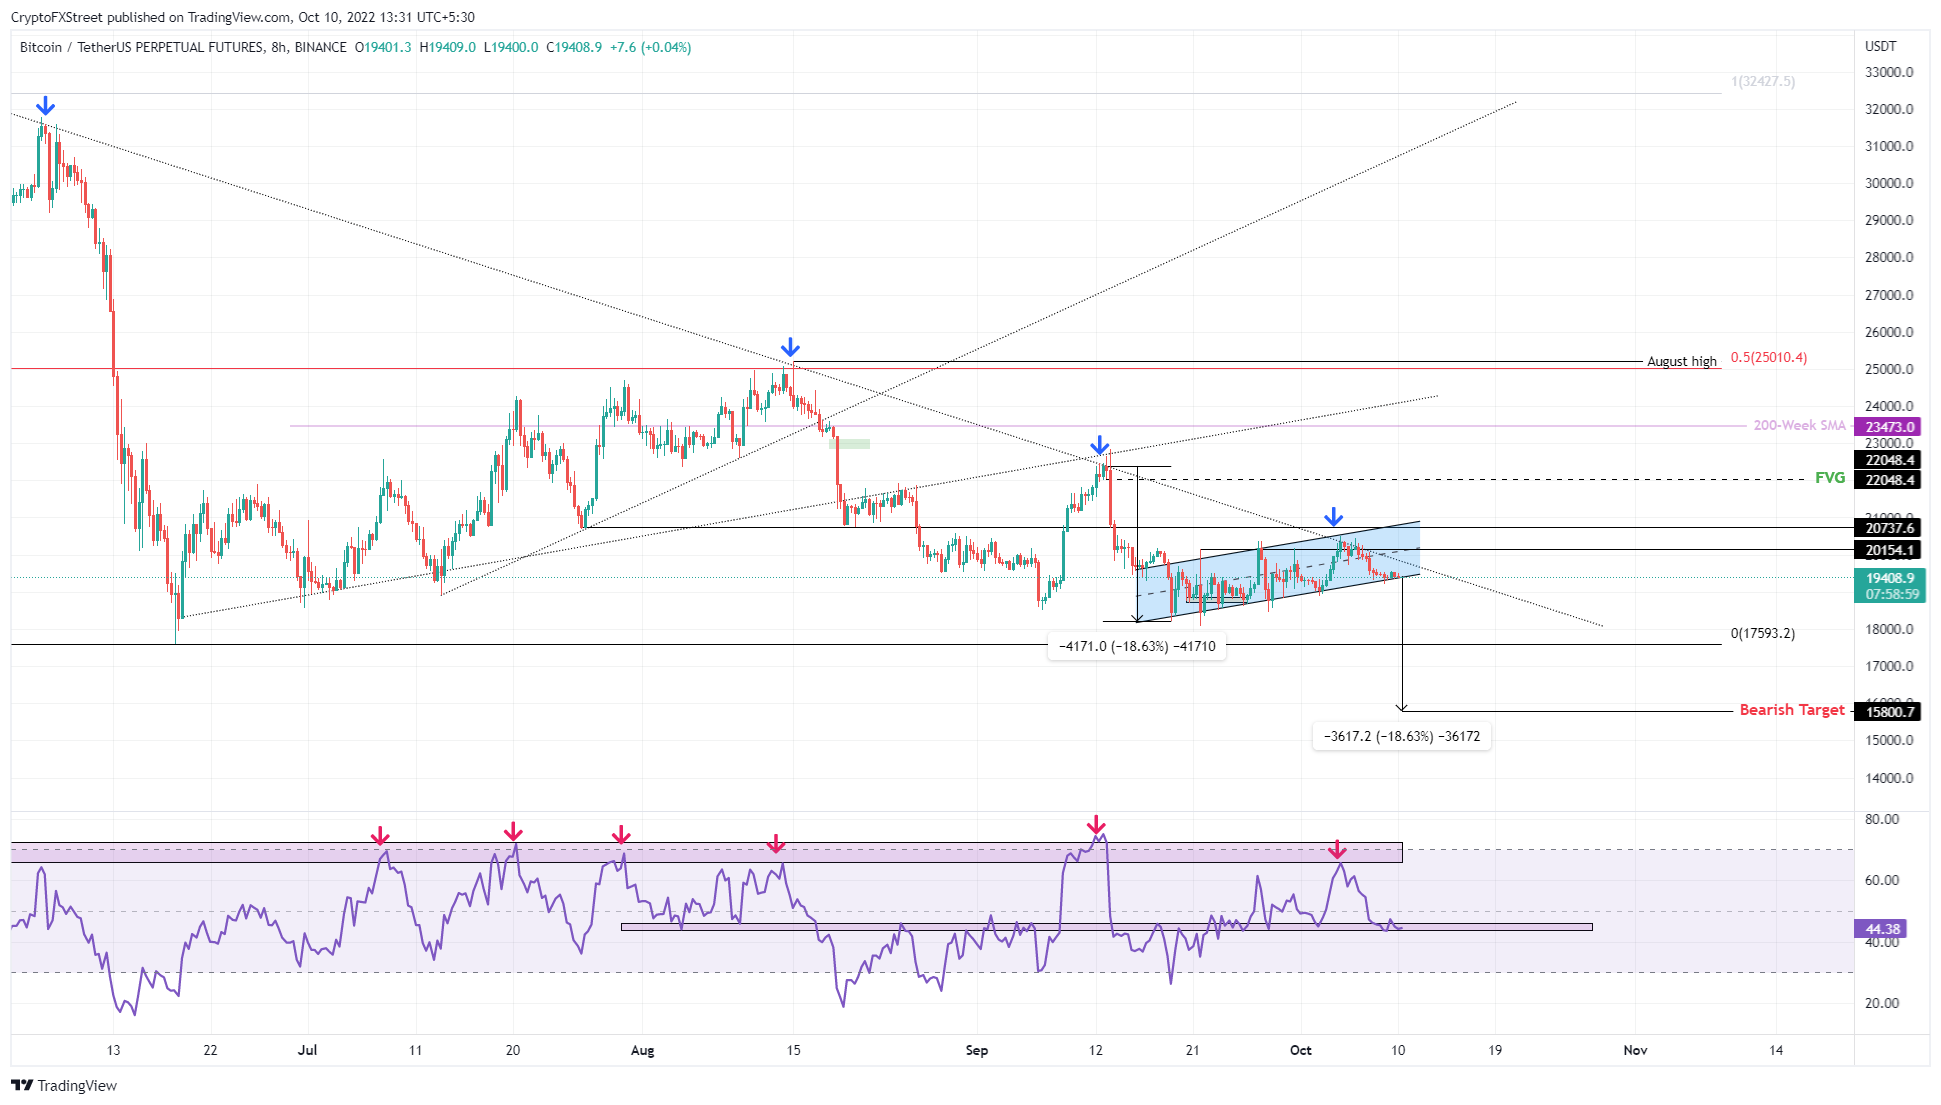
Bitcoin price has retested the lower boundary of the bear flag in the last two days. As discussed in the previous article, this setup predicts an 18% decline if BTC produces a decisive close below the lower limit of the flag and turns it into a resistance level.
However, investors need to be patient and also expect a slight recovery before this bearish breakout triggers an 18% decline. A minor rally to $20,154 or $20,737 could be in the offing for the Bitcoin price as the RSI bounces off the 43 to 46 support level for the fourth time in less than two weeks.
A subsequent breakout from the bear flag could see BTC look back at the June 18 swing at $17,593. On a strong selloff, the Bitcoin price will reach the projected target of $15,800.

BTC/USD 8-hour chart
On the other hand, if the Bitcoin price turns the $20,737 barrier into a support level, it will invalidate the bearish thesis. Such a development could push BTC back to the $22,048 and $23,473 barriers.
Ethereum price remains range
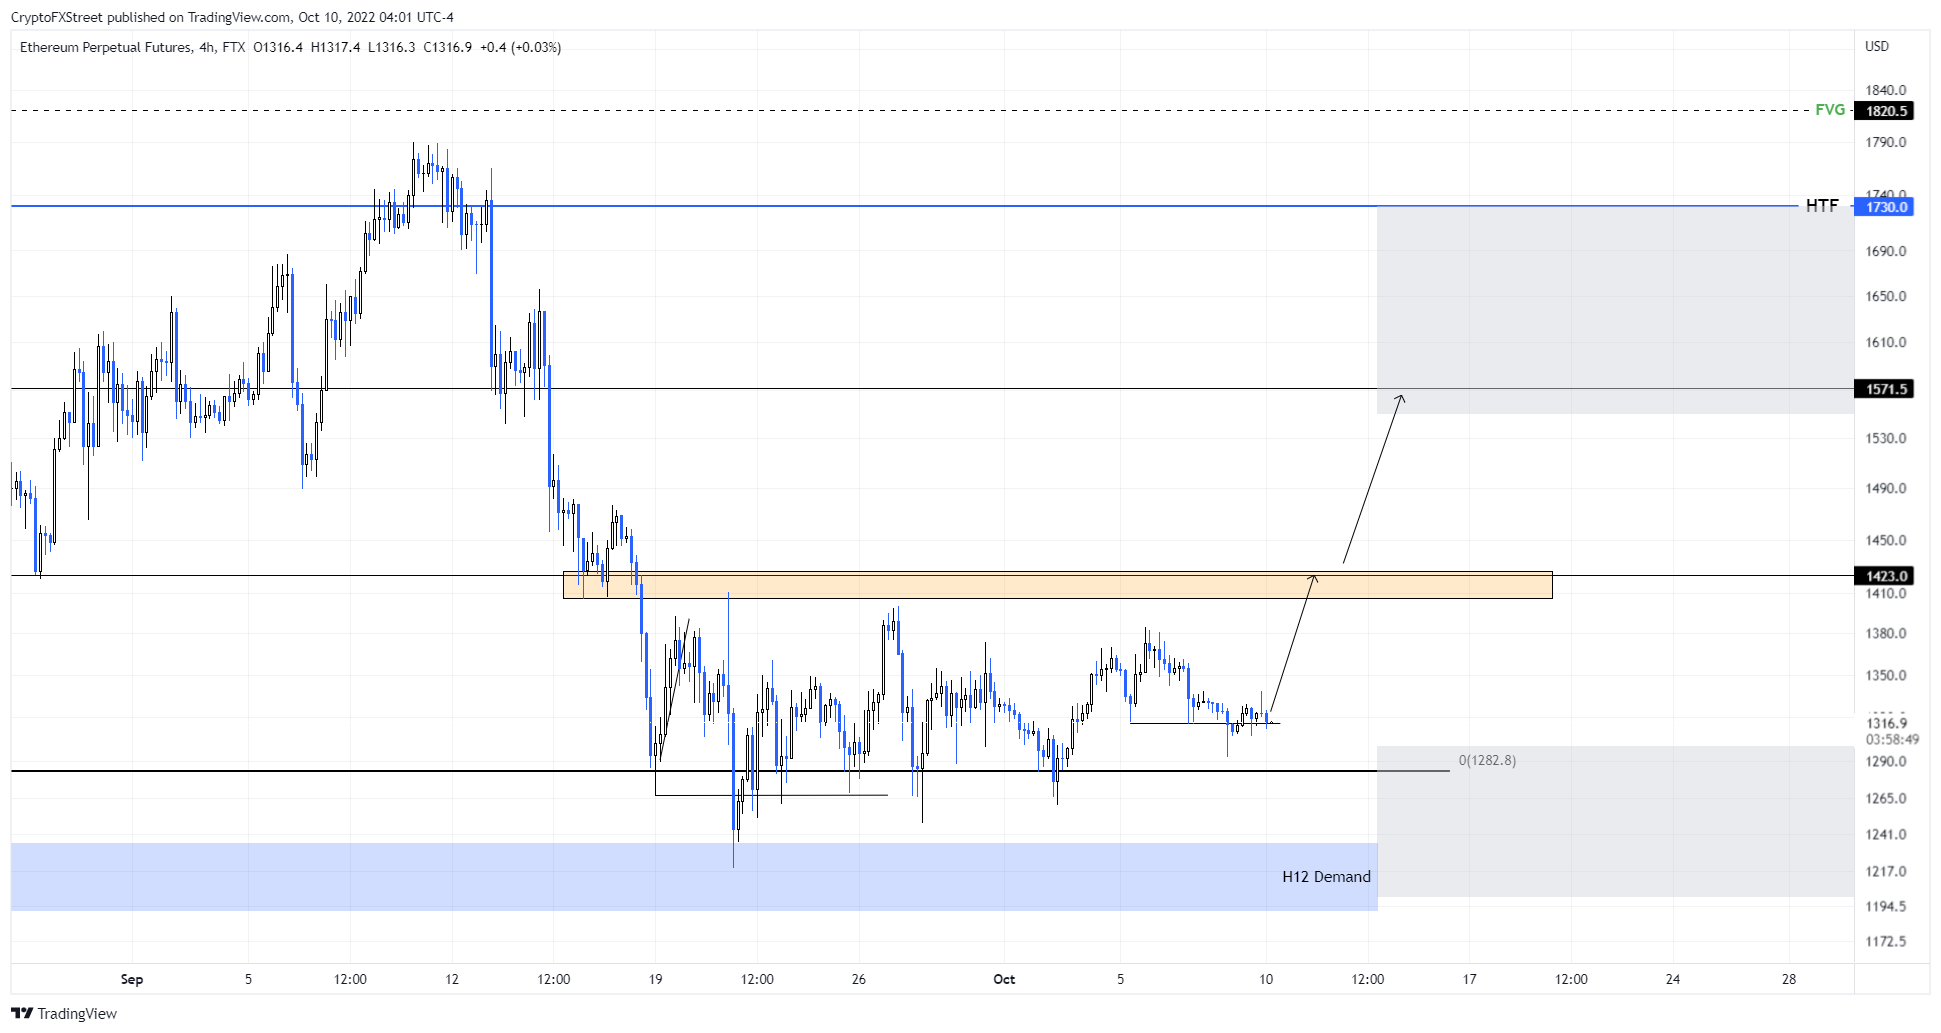
Ethereum price has tested the patience of holders as it remains bound between $1,280 and $1,423 levels. The recent wave of similar lows at $1,315 was a cue for bulls to take over and trigger a quick rally.
However, the buyers have decided not to take a step further. As a result, the Ethereum price is holding above the $1,315 level. Investors can expect volatility, potentially favoring bulls to drive ETH to $1,383 eventually, and, in some cases, the $1,423 barrier.

ETH/USD 4-hour chart
Regardless of the bullish outlook, if the Ethereum price fails to hold above the $1,282 barrier, it will indicate weak bullish momentum. This development will invalidate the bullish thesis for XRP price and potentially trigger a correction to $1,191 via $1,234.
Ripple price ready to tackle more obstacles
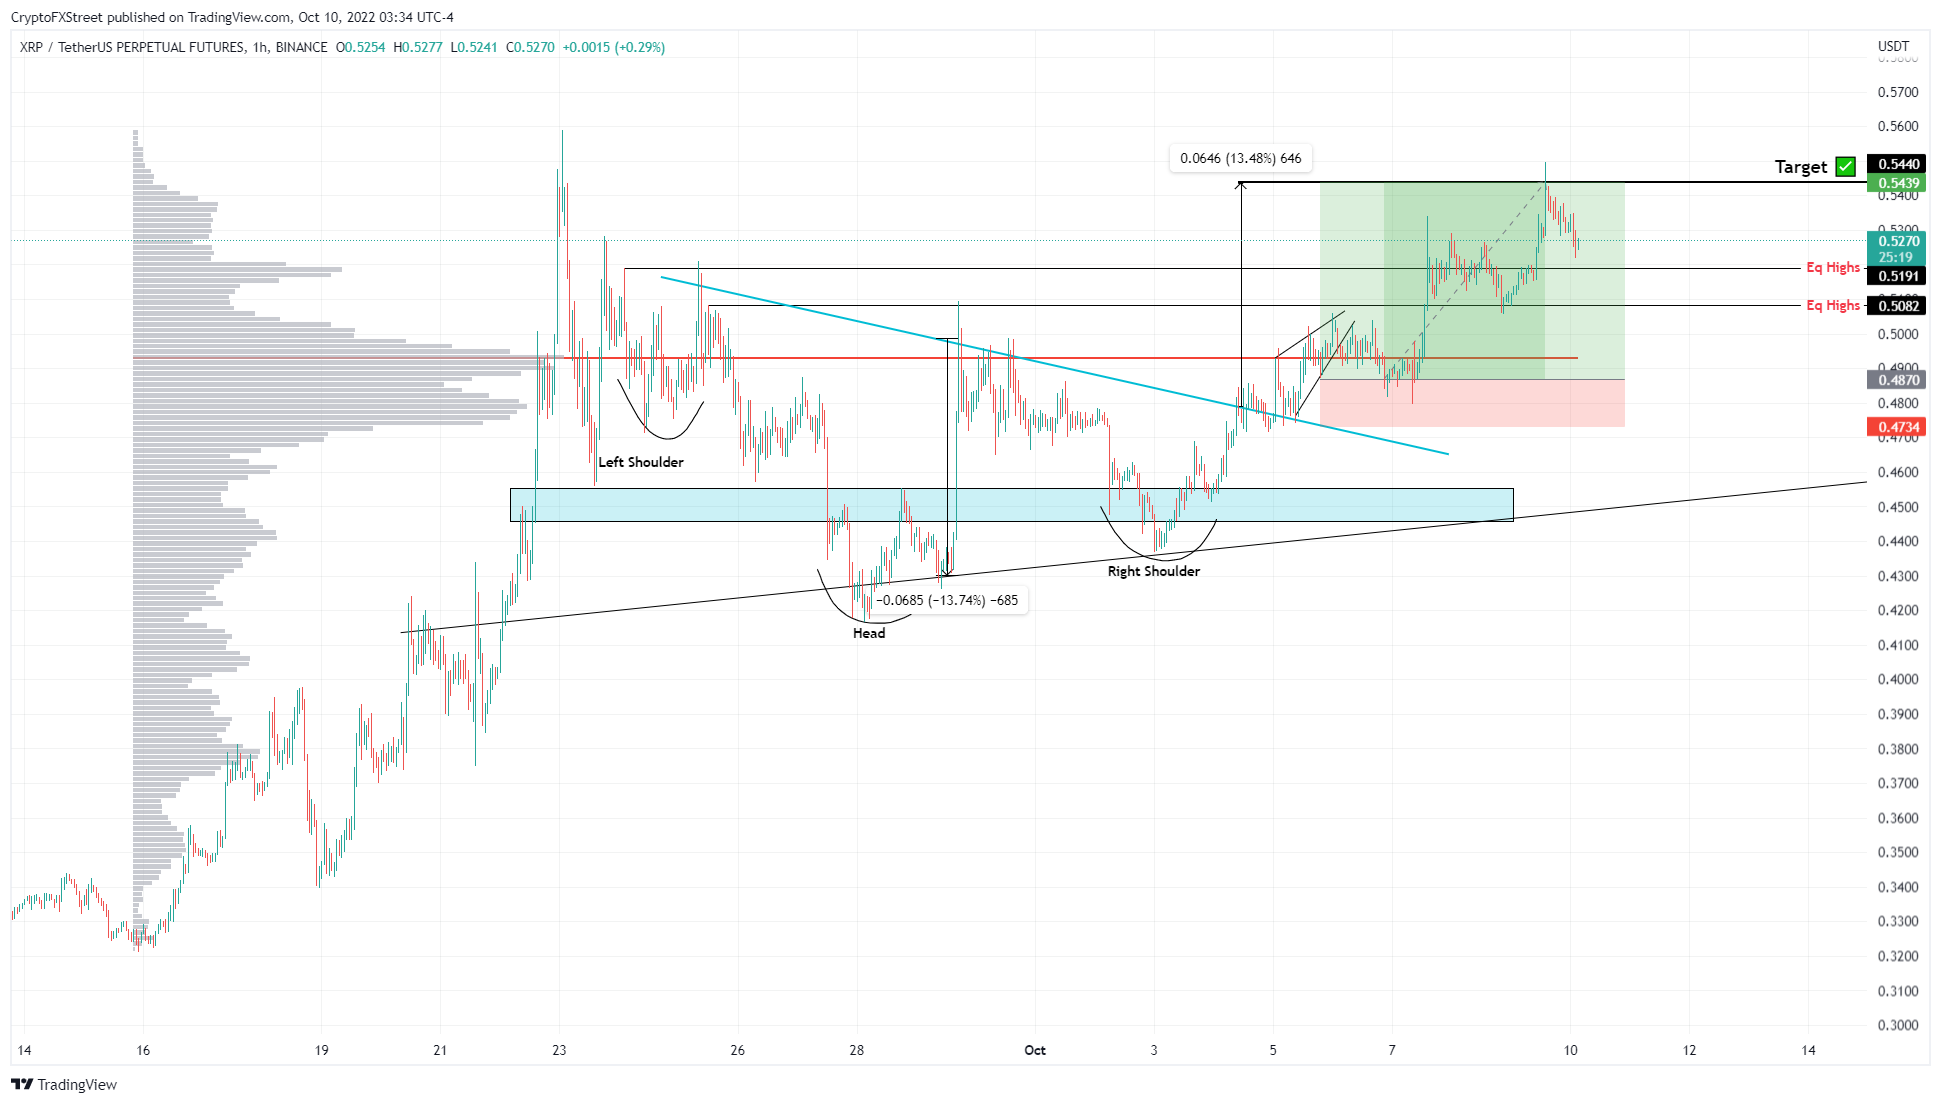
Ripple price has marked the inverse head-and-shoulders target at $0.5440, as mentioned in the previous article. After a 13% rally and rejection at $0.5380, the remittance token is likely to return to $0.4980 and rebalance the imbalance that is there.
A bounce from the current level should have enough momentum to propel the altcoin to $0.5990 – the midpoint of the $0.2860 to $0.9120 range. This area was formed when the XRP price crashed 69% between late March and mid-June.
Therefore, an increase in buying pressure after a minor pullback would make sense for a mean reversion move that would drive the Ripple price to $0.5990 or roughly $0.6000.

XRP/USD 4-hour chart
While things are looking up for Ripple price, a break of $0.4791 would invalidate the bullish thesis. In such a case, the XRP price could crash 8% and return to the $0.4400 support level.


