Bitcoin, Ethereum and EOS were sent higher on Sunday
Bitcoin Analysis
Bitcoin’s price ended six straight days of relentless selling pressure from bearish traders on Saturday and has since put together a streak of two straight green lights as we start a new week. BTC’s price was +$309.1 on Sunday as traders settled at 12:00 UTC.
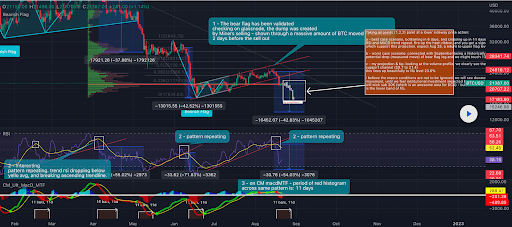
As we can see on this week’s first chart for analysis, BTC’s price validated a bear flag it painted on the daily time frame late last week. The first chart to lead a new week is BTC/USD 1D Chart below from prototypeB. BTC’s price is trading between 0.236 [$21,176.78] and 0.382 [$23,368.12]at the time of writing.
Bullish BTC traders puts in what could be considered a bearish backtest if BTC’s price fails at the next overhead target of 0.382. Bulls have a secondary target of 0.5 [$25,139.19]and a third target of .618 [$26,910.27].
Reverse, bearish BTC traders looking to push BTC’s price below the 0.236 fib level followed by a full retracement back to the 0 fib level [$17,634.78] on the weekly time frame.

Bitcoin’s Moving Average: 5-day [$23,229.38]20 days [$23,226.71]50 days [$21,888.49]100 days [$28,543.75]200 days [$36,939.14]Year to date [$33,623.12].
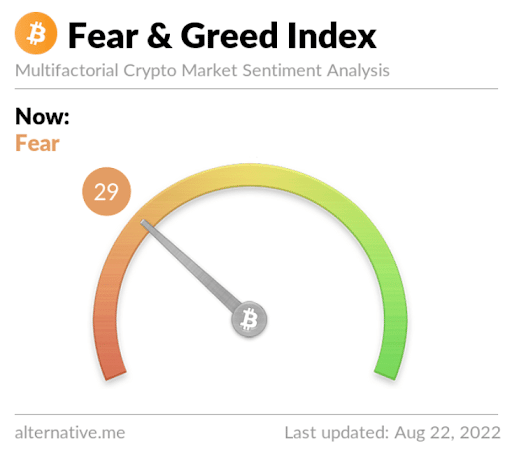
The fear and greed index is 29 Fear and is +2 from Sunday’s reading of 27 Fear.

BTC’s 24-hour price range is $21,069-$21,800 and its 7-day price range is $20,769-$24,995. Bitcoin’s 52-week price range is $17,611-$69,044.
The price of Bitcoin at this date last year was $49,250.54.
The average price of BTC for the last 30 days is $23,063.9 and its -8.3% over the same duration.
Bitcoin’s price [+1.48%] closed its daily candle worth $21,138.8 on Sunday.
Ethereum analysis
Ether price finished back with green digits Sunday after two consecutive bars with red digits. When ETH’s daily session ended on Sunday, ETH’s price was -$45.8.
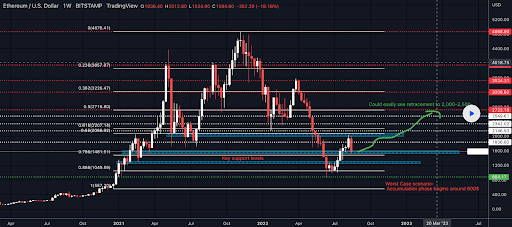
The ETH/USD 1W Chart below of StonkSniper shows Ether’s price is trading between the 0.786 fib level [$1,481.51] and 0.65 [$2,068.92]at the time of writing.
We can see Ether’s price bearishly engulfed the weekly time scale with a massive red candle on Sunday. Bullish traders looking to pivot before 0.786 is reached with overhead targets of 0.65, 0.618 [$2,207.14]and 0.5 [$2,716.8].
Contrary to bulls is bearish traders which has a primary target of 0.786, followed by 0.886 [$1,049.59]and a third goal of 1 [$557.2].

Ether’s Moving Average: 5-day [$1,840.54]20 days [$1,727.90]50 days [$1,417.11]100 days [$1,946.65]200 days [$2,656.03]Year to date [$2,340.37].
ETH’s 24-hour price range is $1,562.34-$1,646.52 and its 7-day price range is $1,523.67-$2,004.15. Ether’s 52-week price range is $883.62-$4,878.
The price of ETH on this date in 2021 was $3,243.49.
The average price of ETH for the last 30 days is $1,700.12 and its +5.46% during the same time frame.
Ether price [+2.91%] closed its daily candle on Sunday worth $1,621.38.
EOS analysis
EOS has marked up over 10% for the last two daily sessions, and as Sunday’s daily session ended, EOS was +$0.16.
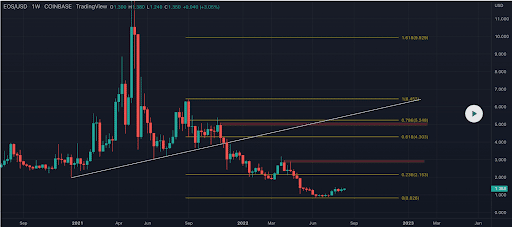
The last chart we look at this Monday is EOS/USD 1W Chart of crytobullmike. EOS trades between the 0 fibonacci level [$0.826] and 0.236 [$2.153]at the time of writing.
The above goals for bullish EOS market participants are 0.236, 0.618 [$4.303]and 0.786 [$5.248].
Bearish traders has a primary target of a full retracement back to the 0 fib level with a new 12 month low to come if that level breaks.

EOS’s moving averages: 5-day [$1.38]20 days [$1.27]50 days [$1.09]100 days [$1.47]200 days [$2.16]Year to date [$1.85].
EOS is +19.01% against the US dollar in the last 90 days, +61.3% against BTC and +45.6% against ETH, over the same time frame.
The 24-hour price range for EOS is $1.37-$1.58 and its 7-day price range is $1.25-$1.63. The 52-week price range for EOS is $0.816-$6.41.
The price of EOS on this date last year was $5.41.
The average price of EOS in the last 30 days is $1.26 and its +41.46% over the same period.
The price of EOS [+11.27%] closed its daily candle on Sunday worth $1.57 and in the green for the second day in a row.


