Bitcoin price bears continue to push, why drop to $20,000 is still possible
Bitcoin price broke the key support zone at $22,000. BTC is showing bearish signs and may fall further towards $20,500 or even $20,000 in the short term.
- Bitcoin gains bearish momentum below the $22,000 support zone.
- The price is trading below $22,000 and the 100 hourly simple moving average.
- A major bearish trend line is forming with resistance near $22,050 on the hourly chart of the BTC/USD pair (data feed from Kraken).
- The pair may continue to move down towards the $21,200 support or even $20,500.
Bitcoin price extends fall
Bitcoin price failed to start a recovery wave above the $22,250 resistance zone. BTC bears remained in action and pushed the price further below the $22,000 support zone.
That opened the door for more losses and the price fell below $21,800. A new monthly low was formed near $21,600 and the price is now consolidating losses. Bitcoin price is now trading below $22,000 and the 100 hourly simple moving average.
An immediate resistance is near the $21,840 level. It is near the 23.6% Fib retracement level for the downward move from the $22,600 swing high to the $21,600 low.
The next major resistance is near the $22,000 zone. There is also a major bearish trend line forming with resistance near $22,050 on the hourly chart of the BTC/USD pair. The trend line is near the 50% Fib retracement level for the downward move from the $22,600 swing high to the $21,600 low.
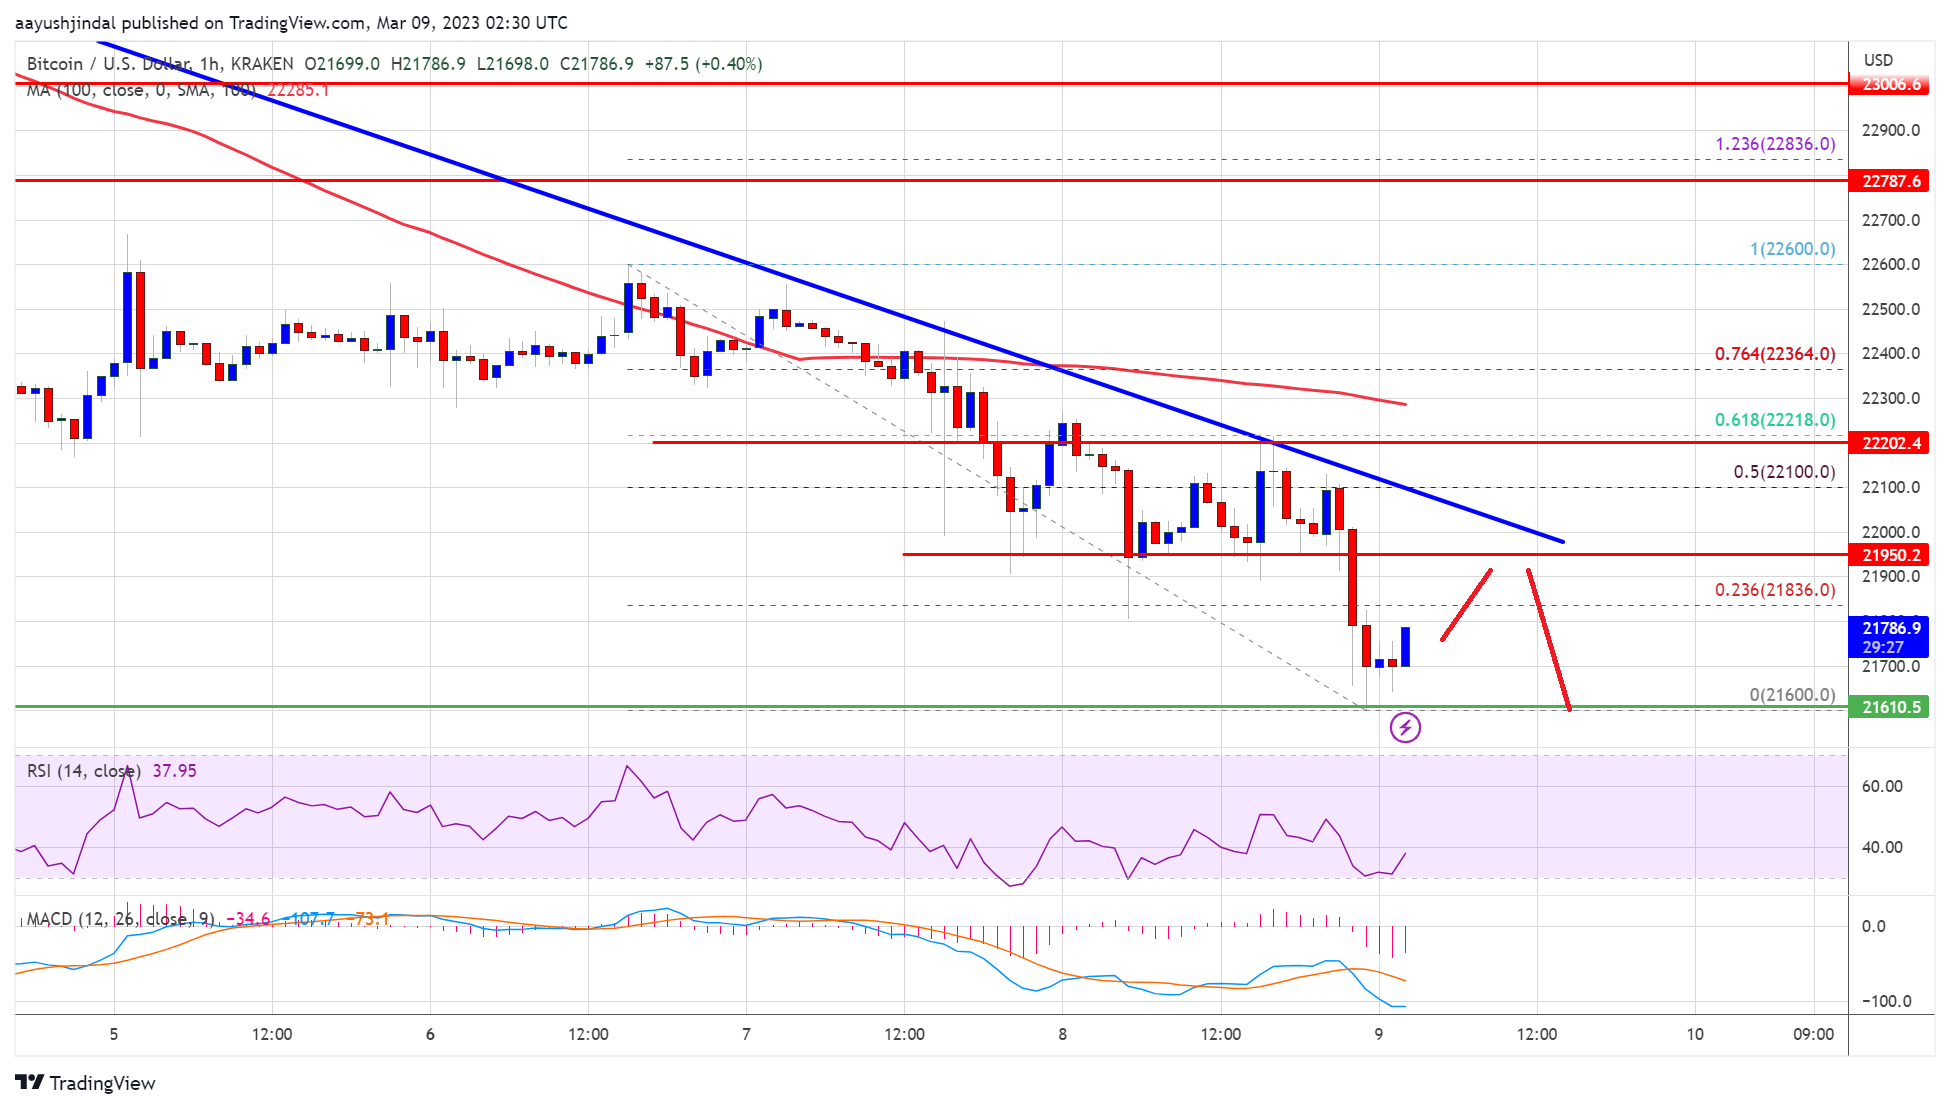

Source: BTCUSD on TradingView.com
The main resistance is now near the $22,250 zone. A close above the $22,250 resistance could initiate a decent rally towards the $22,600 resistance zone. The next key resistance is near the $23,000 zone, above which the price could gain bullish momentum.
More losses in BTC?
If the bitcoin price fails to clear the $22,000 resistance and the trendline, it could start another decline. An immediate support on the downside is near the $21,600 zone.
The next major support is near the $21,200 zone, below which the price could fall to $21,000. The next major support is near the $20,500 level. Any further losses could send the price towards the $20,000 level.
Technical indicators:
Hourly MACD – MACD is now picking up speed in the bearish zone.
Hourly RSI (Relative Strength Index) – RSI for BTC/USD is now below the 50 level.
Major support levels – $21,600, followed by $20,500.
Major resistance levels – $22,000, $22,050 and $22,250.


 approach to fractional NFTs")