Making money vs chasing profit
- Bitcoin price is rising in a turbulent manner, raising questions about the bullish strength.
- Ethereum price is in profit from Monday’s bullish trading setup. Open positions must be managed safely.
- Ripple’s XRP price remains dangerous as bulls retreat into a descending weekly trend channel.
The crypto market continues to make impressive gains. All bullish trade setups should be managed safely to ensure sound risk management.
The Bitcoin price follows the technicals
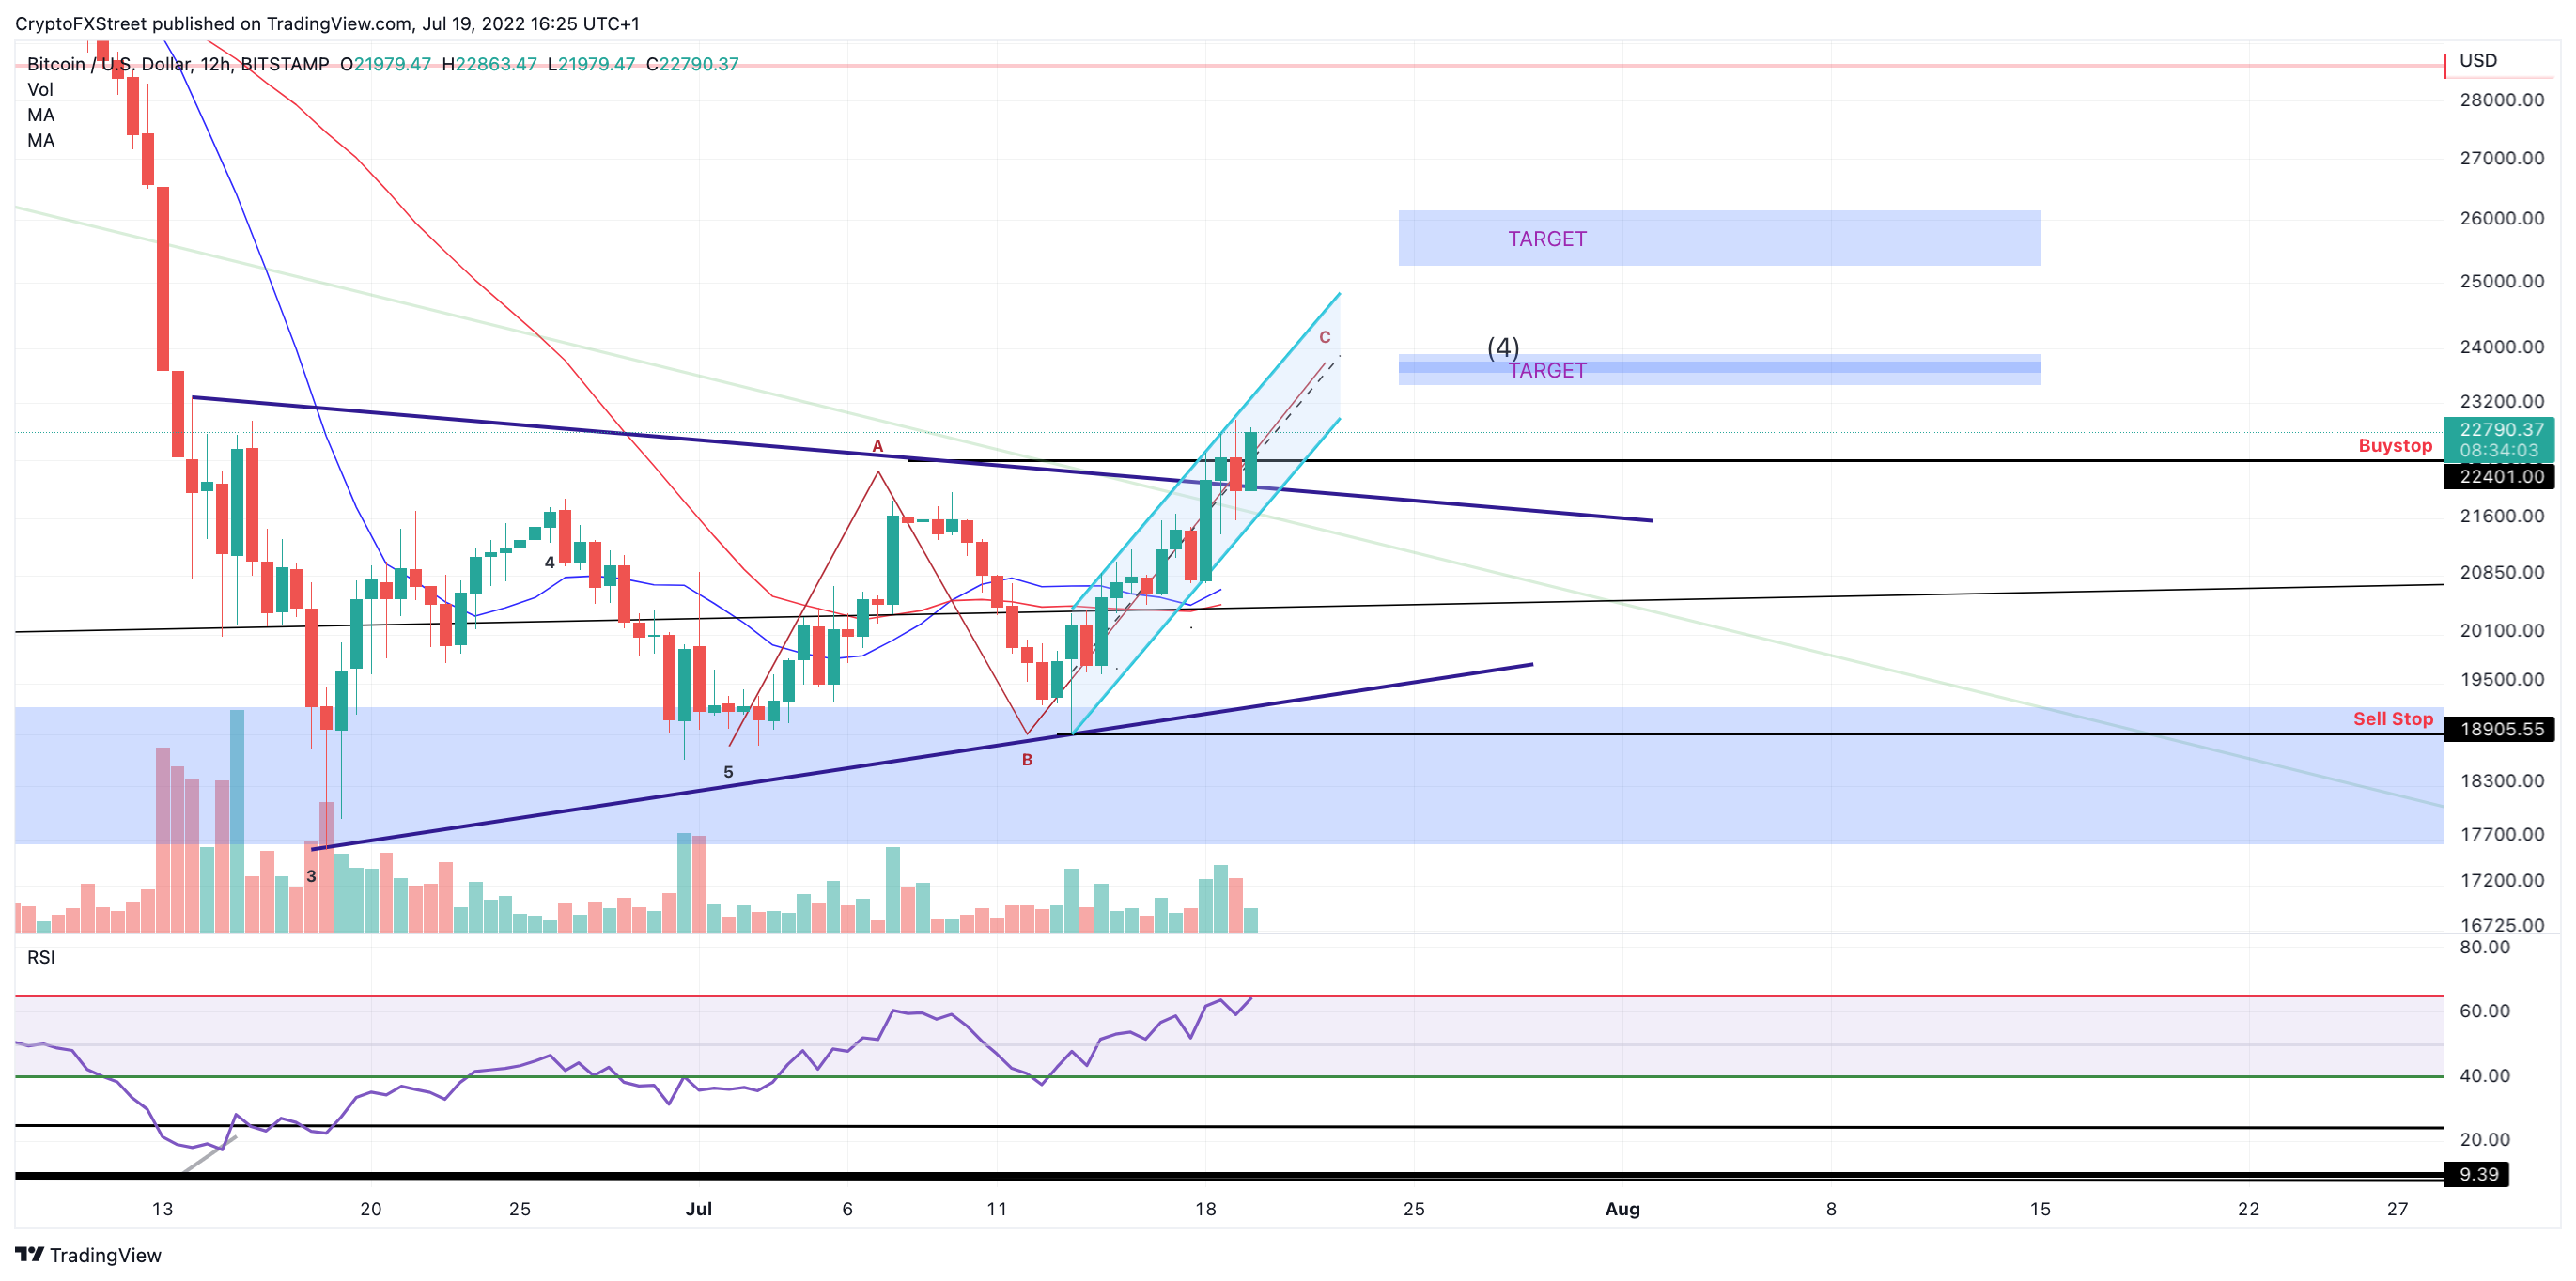
The Bitcoin price, at the time of writing, is auctioned at $22,662. The bulls have successfully invalidated the persistent triangle formation to start the third week of July. Last week’s bullish thesis mentioned the likelihood of a break of $22,000. Still, the ascent has not come easily. There has been noticeable congestion amid the 9% rise since the weekend for the BTC price, raising questions about the market’s overall strength.
Bitcoin price should continue higher as technicals show higher lows established on the 12-hour chart. In addition, the BTC price has established its highest market value in over a month. Still, a break of the lower end of the recently found parallel channel could be an early indicator that bulls are starting to take profits. BTC price targets remain at $23,657 and $25,750.

BTC/USD 12-hour chart
Invalidating the uptrend is a break below the channel currently located at $21,448. If the invalidation level cannot hold support, the bears could redirect south, targeting $17,000, resulting in a 25% decline from the current Bitcoin price.
Ethereum price is in surplus
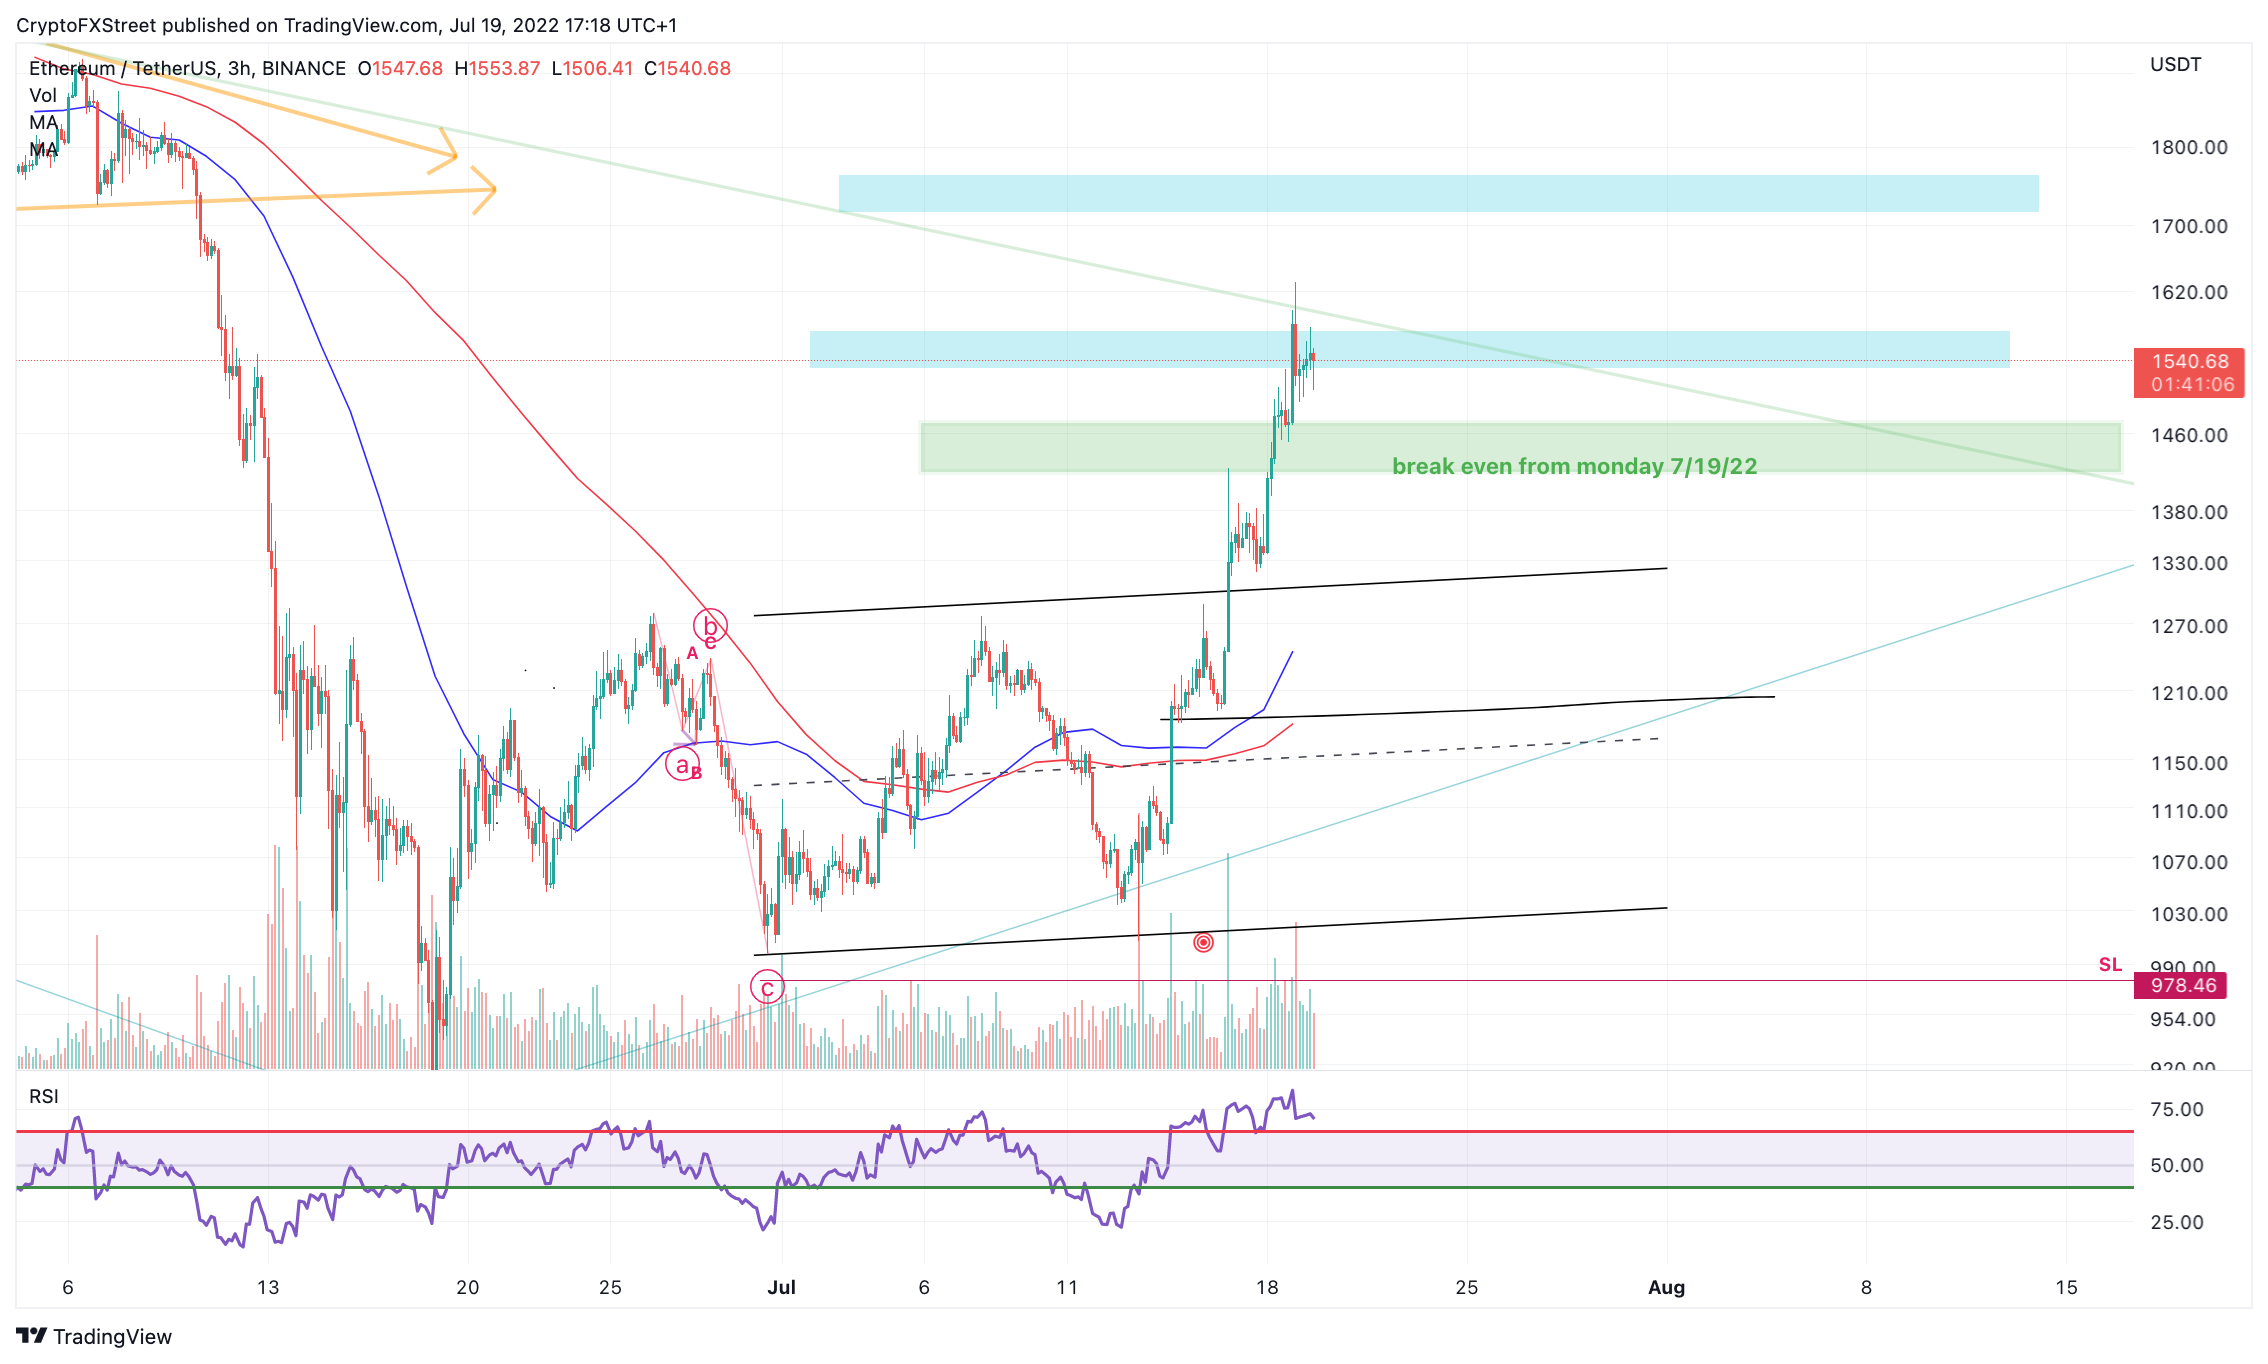
Ethereum price is in profit after Monday’s bullish trading setup. The bulls have experienced a 10% gain as the ETH price continues to climb in leaps and bounds. Nevertheless, the volume indicator shows increased transactions without much price movement. This could be early evidence of bullish exhaustion. Traders who participated in Monday’s trading setup should therefore consider moving their stop losses to break-even.
The Ethereum price is currently auctioned at $1,528. The third bullish target is at $1,780, but the invalidation level remains at $1,304. For the safety of our readers, it is recommended to move the risk to break even. Remember, a breach of $1,304 will set up a bearish scenario targeting $980, resulting in a 35% reduction from the current Ethereum price.

ETH/USDT 3-hour chart
Ripple price is in a scary situation
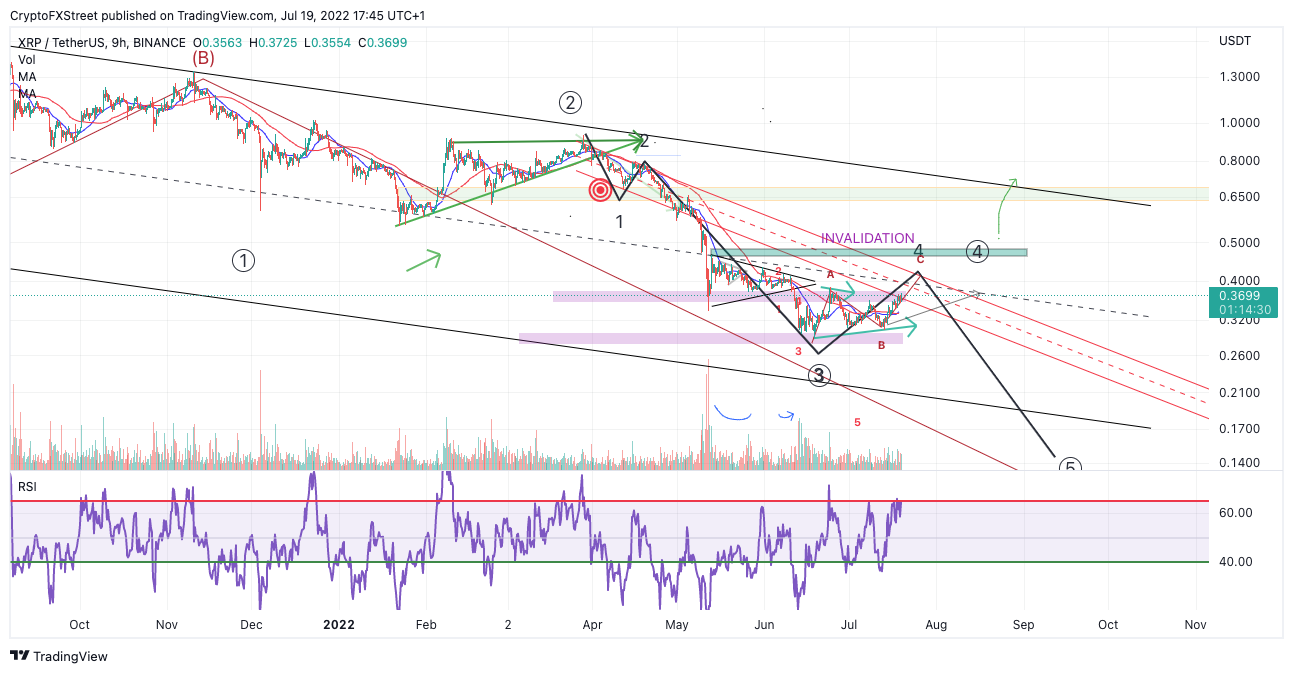
Ripple’s XRP price has retreated to a descending Elliot Wave Trend Channel. XRP price action is similar to Wave 4 criteria, which means Ripple could be setting up for another Wave 5 decline.
The Ripple price has risen 18% in steps since July 11. The congested rise could be an indication of weak hands in the market. The Volume Profile indicator confounds this idea as there is no significant change in average transactions during the rally. Therefore, the bulls should consider looking for better buying opportunities in the market.

XRP/USDT 12-hour chart
A proposed short opportunity may present itself to those willing to take a time-consuming risk. Look for classic sell signals or failure to sustain the current uptrend slope. Aim for $0.20 and below. Invalidation for the bearish thesis would be a break of $0.47. If so, traders should immediately release their positions as the XRP price could rise as high as $0.68, resulting in a 90% increase in market capitalization.


