BTC retreats below $24,000 support levels, further decline expected – Cryptopolitan
Our Bitcoin price analysis reveals that BTC has entered a bearish zone after failing to hold above the $24,000 support. Bitcoin is trading at $23,943.09 after trading sideways for a few hours. Bitcoin’s trading volume has remained above $35 billion, illustrating strong bearish momentum.
A break below the $23,800 support is likely to trigger further losses in the BTC price. The next major support levels are $22,400 and $21,200. On the upside, immediate resistance is at $24,000 followed by a key hurdle near the $25,000 level. If there is a strong break above the $25,000 resistance area, BTC price could start another rally.
Bitcoin Price Analysis on a Daily Chart: Consolidation Pattern
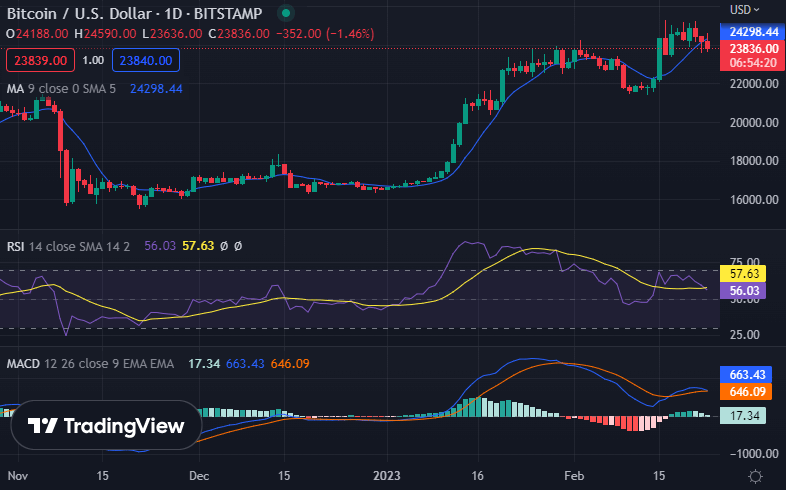
The daily chart Bitcoin price analysis shows that BTC is trading in an area below the $24,000 resistance. The price action is drawing a consolidation pattern, and a break of either the upward or downward trend line could happen soon. A successful break above the upper trendline could open doors for more gains towards $25,000. However, if there is a break below the lower trendline, Bitcoin could test the $22,400 and $21,200 support levels.

The Relative Strength Index is near the 56.03 levels, but it faces strong resistance near the $55 and $60 levels. MACD is slowly losing momentum in the bearish zone, suggesting that there may be more losses in the BTC price.
The moving average lines also highlight a bearish zone. Bitcoin bulls need to defend the $22,400 and $21,200 support levels to start a strong short-term rally. The EMA50 provides solid support at the $22,400 level.
Bitcoin Price Analysis on a 4-Hour: Support and Resistance Levels
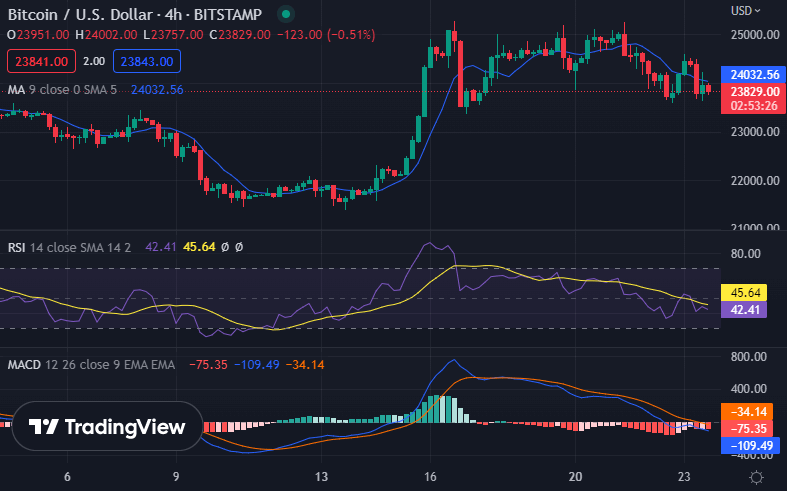
The 4-hour Bitcoin price analysis shows that BTC is struggling to hold the support at $23,800. A break below this level could push the price down towards the next major support at $22,400. On the upside, there is initial resistance near the $24,000 level (recent breakdown zone ). Above this, the BTC price is likely to face resistance near the $24,400 and $25,000 levels.

The RSI for BTC/USD remains below the 50 level, suggesting that the bears are still in control. If there is a break below the $23,800 support, BTC price may soon test the 50-SMA at $22,400. The price of Bitcoin is trading above the psychological level of $23,000 and if it dips below this level, we may see a further decline to $21,200 range. The stochastic RSI for BTC/USD is dropping and it may soon test the oversold area. This indicates that there may be a bearish trend in the short term.
Bitcoin price analysis conclusion
Bitcoin price analysis for today shows that BTC is trading in a bearish zone below the $24,000 level. The next major support levels are $22,400 and $21,200. A break above the $25,000 resistance area is needed to reverse the trend. Bulls are still keeping an eye on the $23,800 support to protect against further losses. If the BTC price does not hold above this level, it could extend the decline towards $22,400 and $21,200.
While you wait for Bitcoin to move forward, check out our price estimates on XDC, Cardano and Curve


